
Overview
The 30-minute pivot is a specific, repeatable setup: a stock pulls back into support, stops going down on the 30-minute chart, and the first candle that turns becomes the trigger.
This indicator watches for that sequence, marks it while it’s still forming, and draws the exact price that has to be taken out — with the stop already calculated.
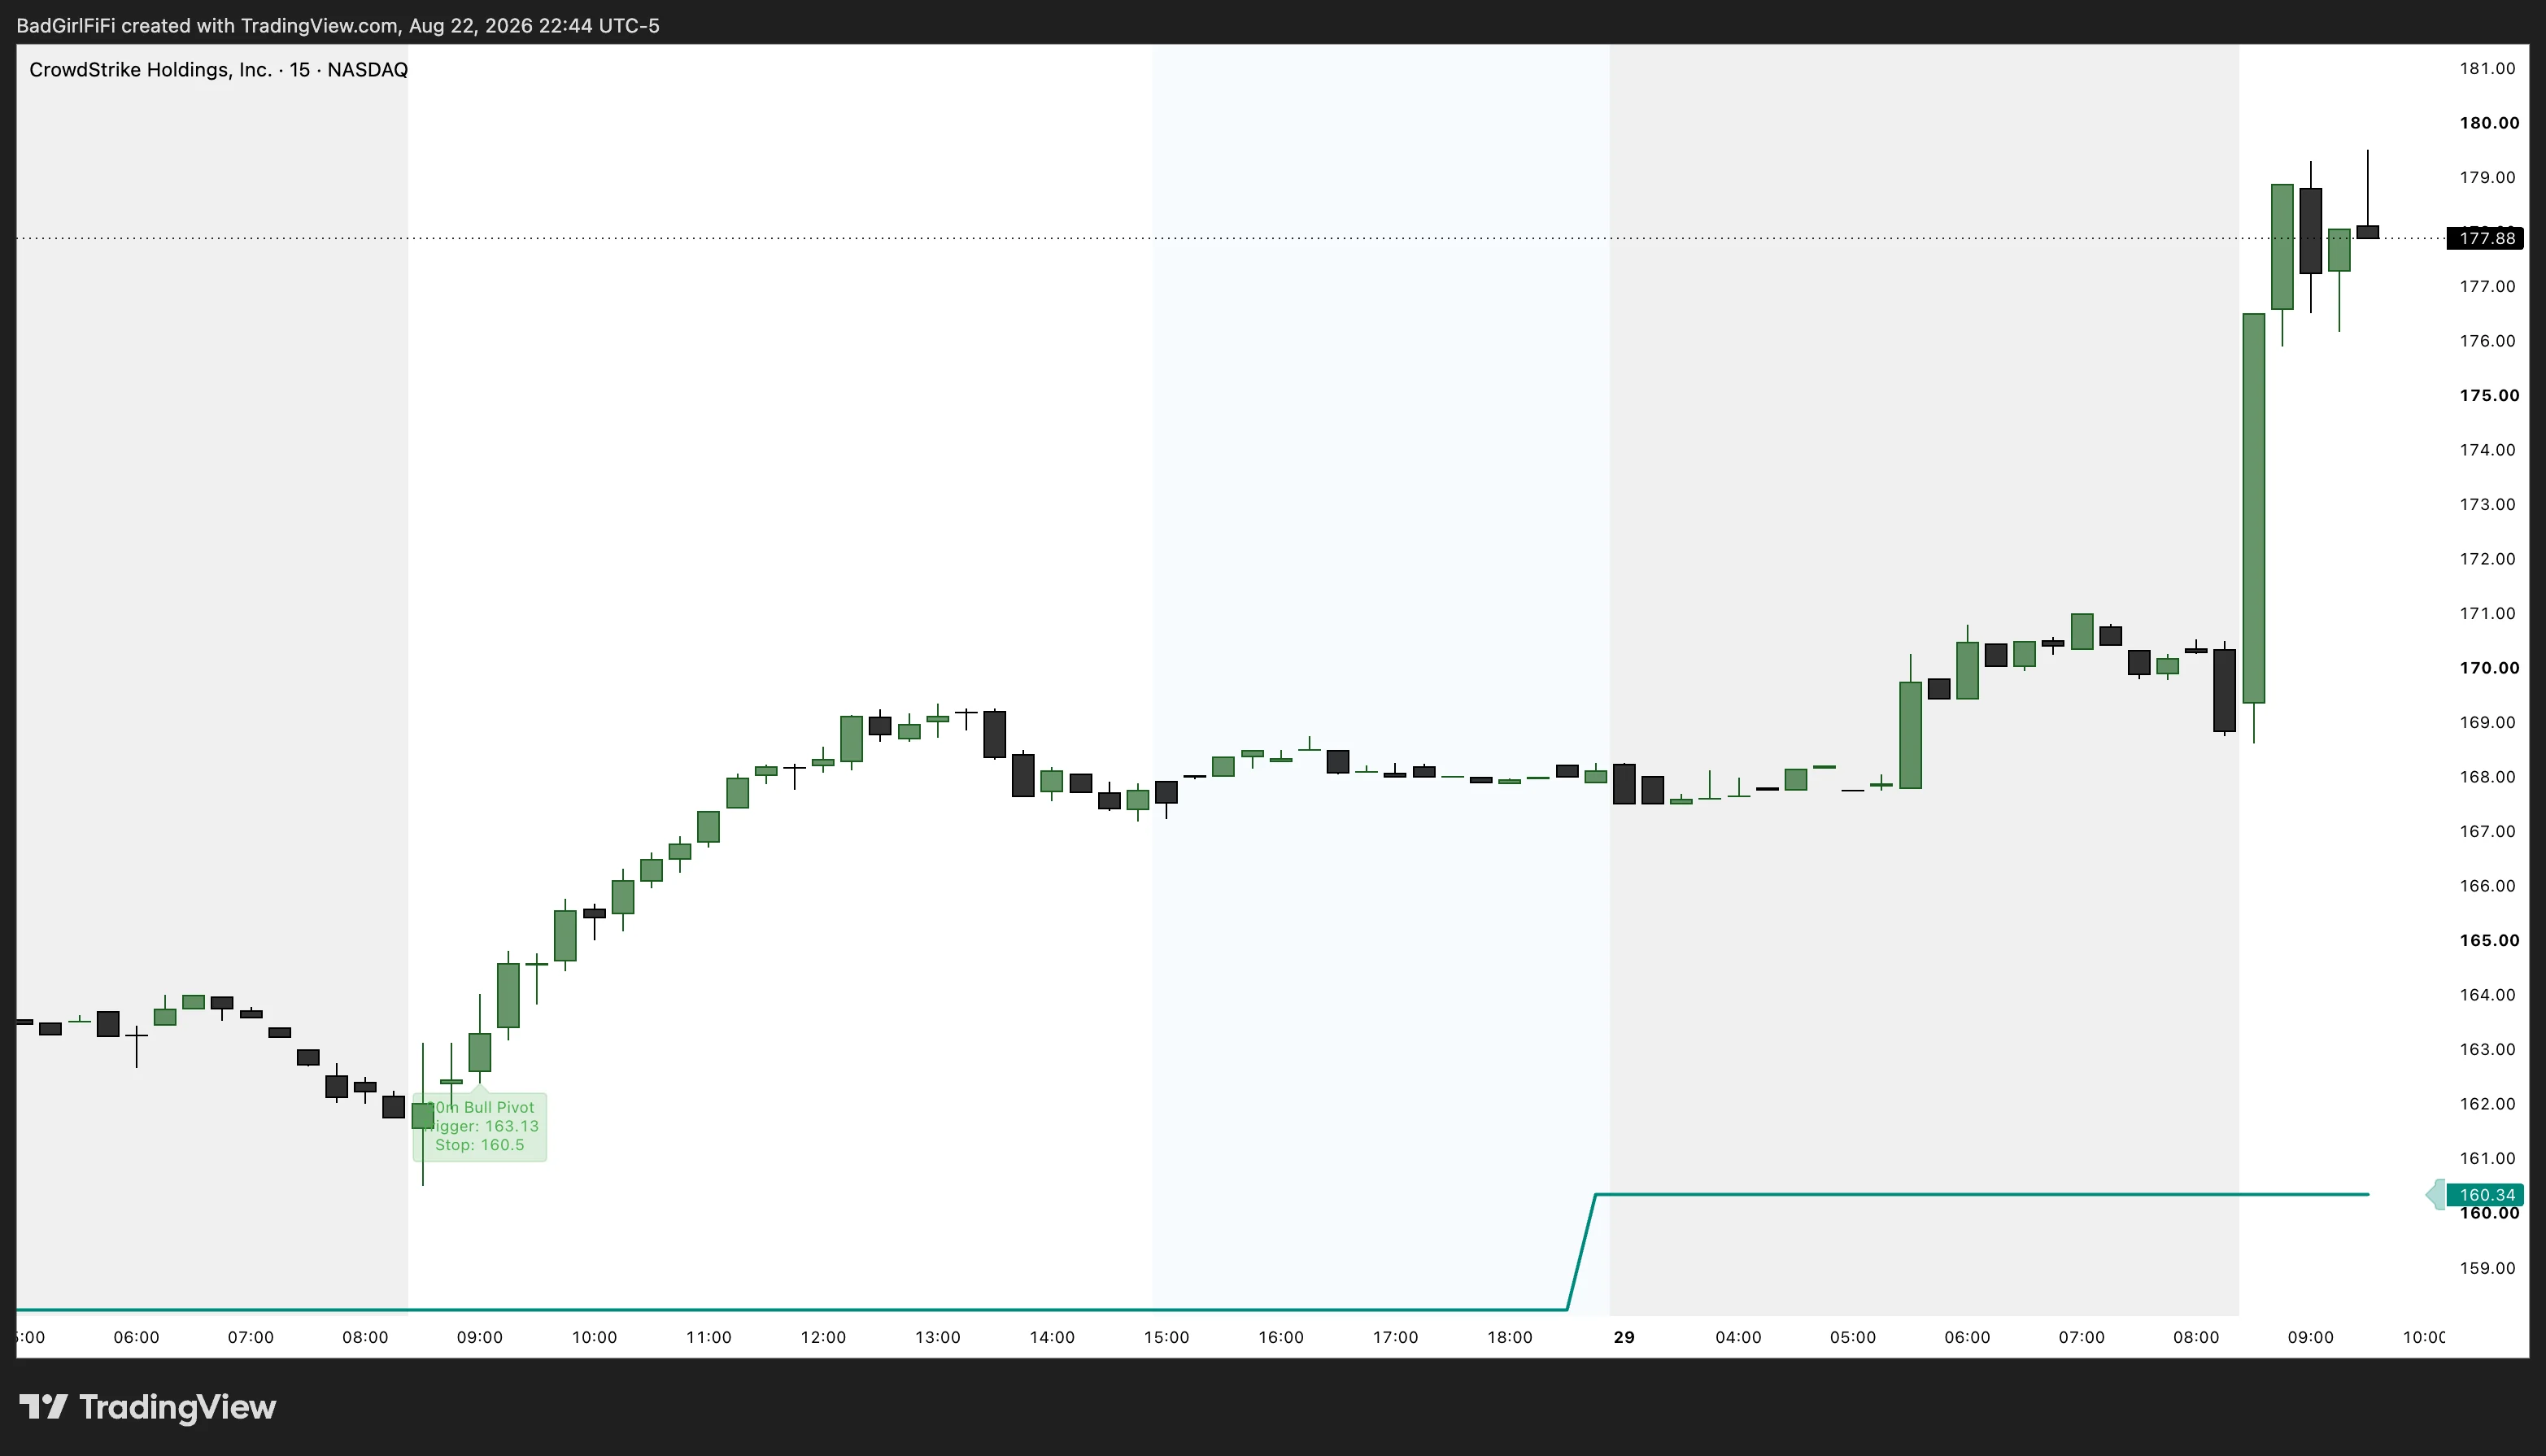 A bull pivot on CRWD. Trigger 163.13, stop 160.50 — both printed on the label when it fired. Price ran to 179 over the following session.
The strategy it automates
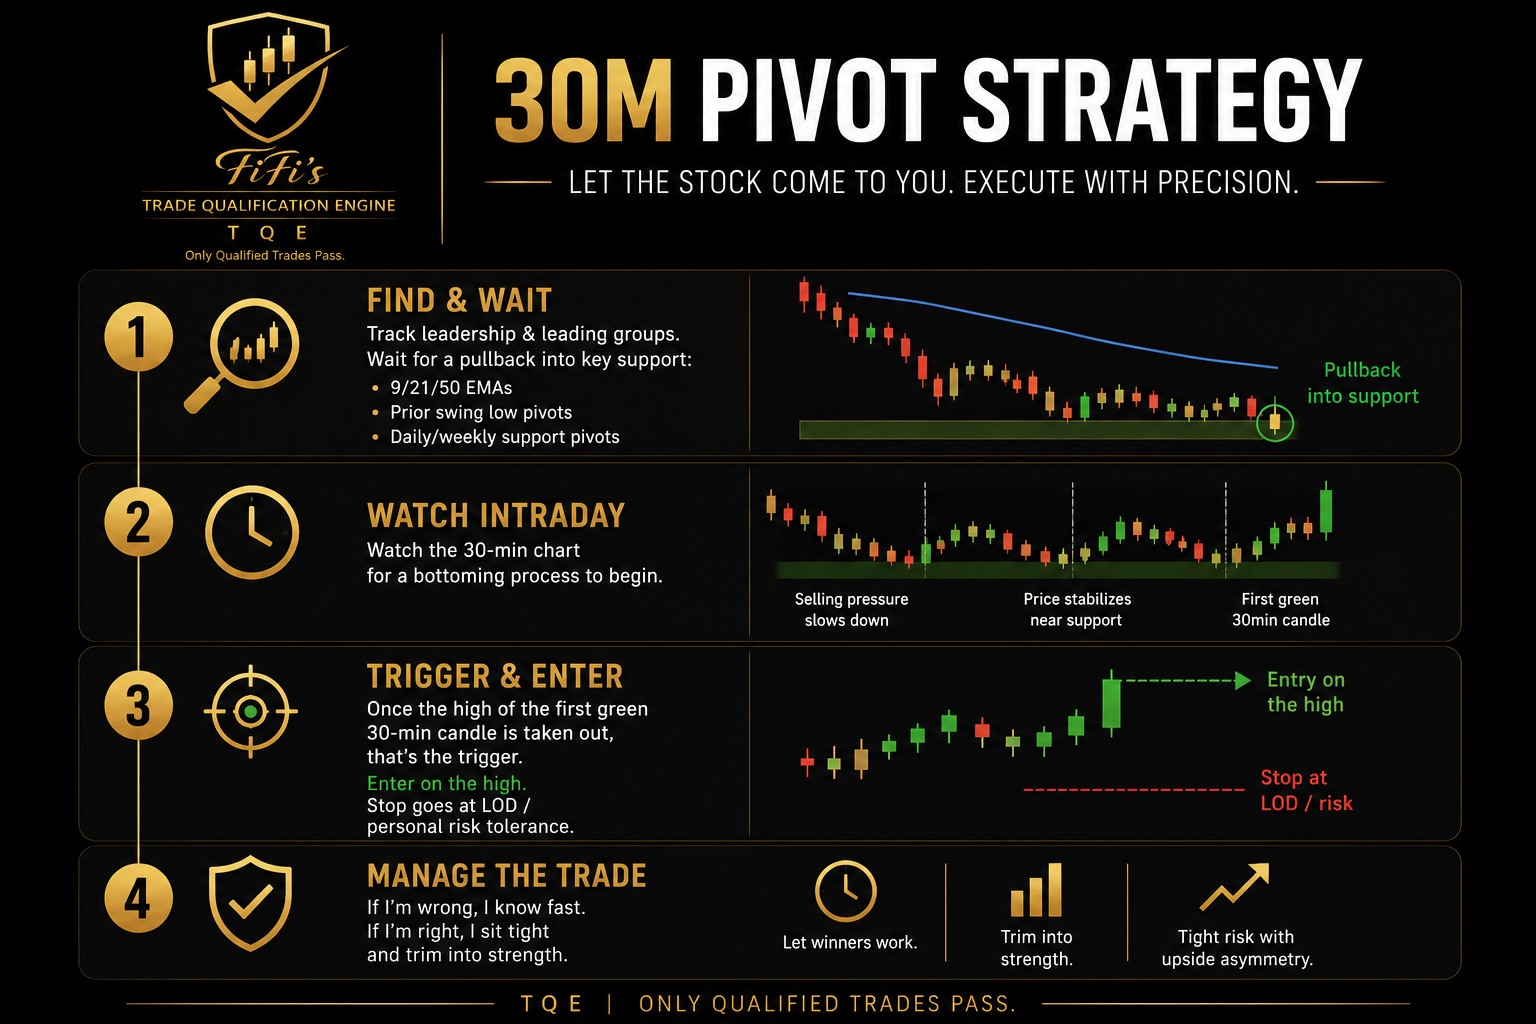
Let the stock come to you. Execute with precision.
1 · Find and wait. Track leadership and leading groups. Wait for a pullback into key support — the 9, 21 or 50 EMAs, prior swing low pivots, daily or weekly support pivots.
2 · Watch intraday. Watch the 30-minute chart for a bottoming process to begin: selling pressure slows, price stabilises near support, then the first green 30-minute candle prints.
3 · Trigger and enter. Once the high of that first green 30-minute candle is taken out, that’s the trigger. Enter on the high. Stop goes at the low of day, or your own risk tolerance.
4 · Manage the trade. If you’re wrong, you know fast. If you’re right, sit tight and trim into strength.
Want to be told instead of watching? TQE 30m Pivot is this same indicator with alerting — trigger and stop pushed to your phone as the level breaks.
The indicator does steps 2 and 3. Finding the name and managing the trade are still yours — and they’re the parts that decide whether the setup was worth taking.
What it puts on your chart
| Marker | Meaning |
|---|---|
| 🟧 Forming 30m Pivot | A valid setup exists. The turn has happened, the trigger hasn’t been taken out yet. |
| Step line (green or red) | The exact trigger price. This is the level that has to break. |
| Trigger label | Fires on the break, printing the trigger price and the stop. |
The forming label is the useful one. It tells you a setup is live before it triggers, which is when you’d want to be watching — not after.
How a pivot is defined
Bull pivot: the previous 30-minute candle closed green, and the one before it closed red. Selling, then the first sign of buying.
- Trigger — the high of that green candle
- Stop — the low of that green candle
Bear pivot is the mirror: a green candle followed by a red one, trigger at the red candle’s low, stop at its high.
Dojis count as the turn in both directions, so a candle that closes exactly where it opened doesn’t cause the setup to be missed.
The three filters
All three are on by default. They exist to keep you out of chop, and turning them off will produce noticeably more setups of noticeably lower quality.
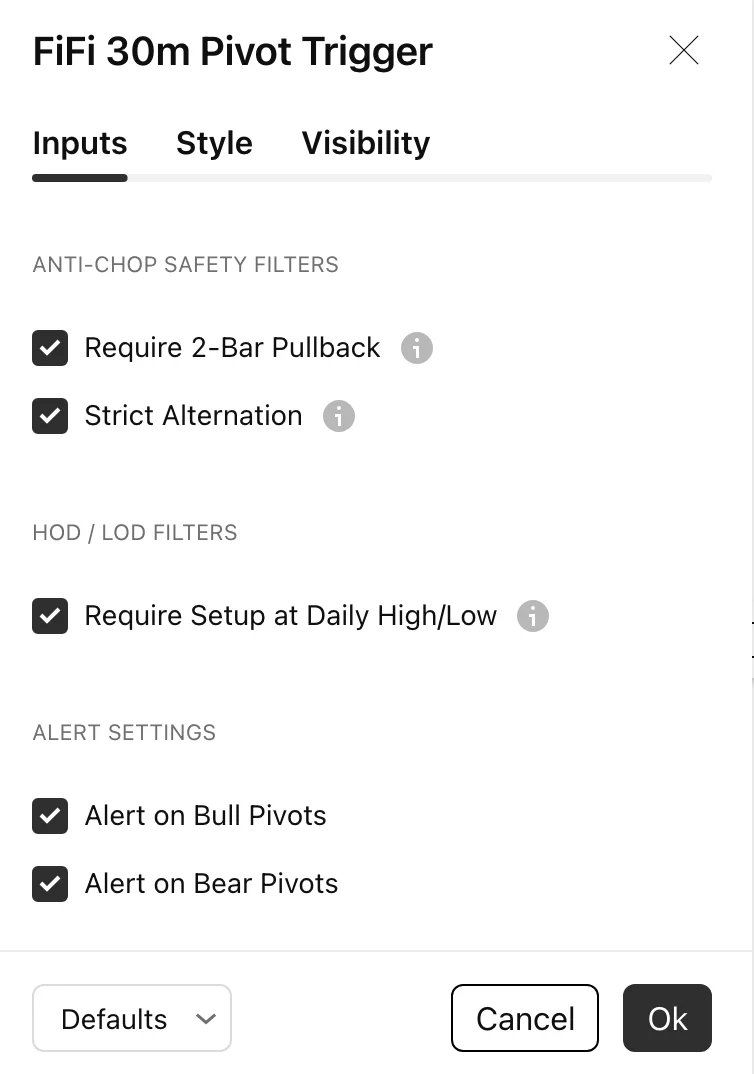
Require 2-Bar Pullback. Demands at least two consecutive candles in the pullback direction before the turn — red, red, green rather than red, green. A single red candle inside a sideways drift isn’t a pullback, it’s noise.
Strict Alternation. Prevents multiple long setups firing in a row without a short setup in between. Without it, a stock grinding along the low of day can produce the same bull setup over and over.
Require Setup at Daily High/Low. Only allows bull pivots at the low of day and bear pivots at the high of day. This is the filter that turns a common candle pattern into a location — the turn only counts where the day’s extreme actually is.
Timing rules
Regular session only, and nothing before 10:00 ET. The first 30 minutes of the day are excluded entirely — the opening range is too disorderly for the pattern to mean anything, and the day’s high and low haven’t settled into anything worth measuring against.
Everything resets at the start of each new 30-minute bar: the forming labels, the triggered state, the invalidation flags.
Invalidation — why a forming label disappears
If price trades through the stop level before the trigger fires, the setup is dead for that 30-minute period. The forming label is removed and no trigger will fire from it.
This is the case people ask about most: you saw an orange label, you looked away, it’s gone. That isn’t a bug and it isn’t a missed alert. It means price broke the low of the candle that was supposed to hold, and the setup failed before it ever became a trade.
Which chart timeframe to run it on
The pattern is read from 30-minute data, but the indicator runs on whatever chart you’re on — so use a lower timeframe than 30 minutes.
On a 5 or 15-minute chart you get the trigger the moment price takes out the level. On the 30-minute chart itself you’d only find out at the close of the bar, by which point the move is well underway. The example above is a 15-minute chart for exactly this reason.
Settings reference
| Setting | Default | What it does |
|---|---|---|
| Require 2-Bar Pullback | On | Requires two consecutive candles in the pullback direction before the turn |
| Strict Alternation | On | Blocks repeated setups in the same direction without an opposite setup in between |
| Require Setup at Daily High/Low | On | Bull pivots only at the low of day, bear pivots only at the high of day |
Three settings, all boolean. There is nothing to tune — the defaults are the strategy, and each toggle you turn off widens what qualifies.
FAQ
Does it repaint?
No. The pattern is read from completed 30-minute candles only. A setup that appeared on a historical chart is a setup that existed at the time.
Why is nothing appearing before 10:00 ET?
By design. The first 30 minutes are excluded — the opening range is too disorderly and the day’s extremes haven’t settled.
An orange label appeared and then vanished.
Price broke the stop level before the trigger fired, so the setup was invalidated. See Invalidation above.
Should I run it on the 30-minute chart?
No — use 5 or 15 minutes. The pattern comes from 30-minute data regardless, and a lower chart timeframe gets you the trigger as it happens rather than at the next 30-minute close.
Can I trade it without the other TQE tools?
Yes. It’s self-contained. It pairs naturally with anything that tells you where support is — that’s step 1 of the strategy, and this indicator assumes you’ve already done it.
Is there a version that alerts me?
Yes. TQE 30m Pivot, part of the paid suite, draws the same setups with the same filters and adds alerting — the ticker, time, trigger and stop pushed to your phone the moment the level breaks. This version marks everything on the chart; you have to be looking at it.
Ready for the full engine?
This one is free. The Trade Qualification Engine is the paid suite it was built alongside.