
Built by Braamskis, included with TQE membership.
Overview
Most of the work in a retracement strategy is done before the entry: spotting a real impulse move, deciding whether it actually broke structure, then drawing the retracement on exactly the right two points. Do that by hand, live, on a fast chart, and you will draw it wrong or draw it late.
This does all three automatically. It tracks swing structure, watches for a wave that genuinely breaks it, and the moment that wave finishes it drops the retracement on the chart for you — anchored to the correct high and low, with no dragging.
Then it tells you the thing that matters most: whether the setup is still valid.
The four layers
Everything the indicator draws serves one of four jobs.
Confluence lines. The 9 EMA, 21 EMA and VWAP, plotted on your chart. These are the levels a retracement wants to land on — the entry zone lining up with one of them is what separates a good setup from a mediocre one.
Swing structure. Dashed lines marking each swing high and low as it forms. They extend to the right until price closes through them, then disappear — so what’s left on your chart is only the structure that still matters. Highs and lows are cleared and rebuilt whenever the higher-timeframe trend flips.
Painted waves. When a move breaks structure with real force, the candles that made up that move are recoloured. That’s the indicator telling you it saw a genuine impulse rather than drift.
The auto-retracement. As soon as a painted wave completes, the retracement levels appear across it, anchored to the wave’s true extremes including wicks.
The dashboard
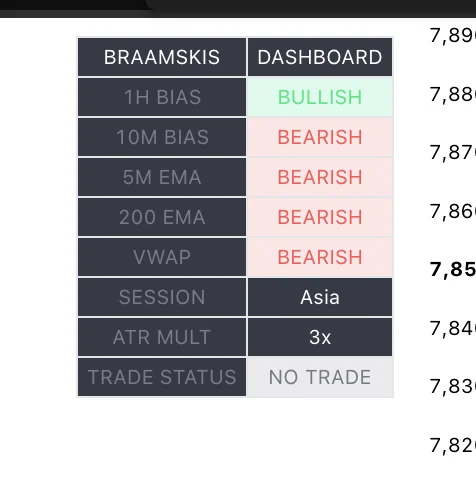
Read it from the top down — it’s ordered from slowest to fastest.
| Row | What it tells you |
|---|---|
| 1H Bias | The hourly trend. Context only — it doesn’t gate anything |
| 10M Bias | The one that matters. This is the trend filter the whole engine keys off |
| 5M EMA | Where the fast averages sit on your execution chart |
| 200 EMA | Price above or below the long-term average |
| VWAP | Price above or below the session’s volume-weighted average |
| Session | Asia, London, New York, or Market Closed |
| ATR Mult | The volatility multiple currently in use for this instrument |
| Trade Status | Whether there’s a live setup right now |
The 10M row is the engine’s actual trend filter. The 1H row is there so you can see when the two disagree — and a 1H that reads bullish over a 10M that reads bearish, as in the screenshot above, is exactly the kind of conflict worth being careful around.
Trade status is the row to watch
Three states, and they mean specific things:
NO TRADE. Nothing is set up. Either no wave has completed, or the last one has already been resolved.
VALID. A wave completed and the retracement is drawn. There is a live setup on the chart right now.
INVALID. Price moved beyond the wave’s own extremes, which means the move that created the setup has been overrun. The setup is dead — don’t take it. It reverts to NO TRADE on the next bar.
The status is not a signal to enter. VALID means the geometry is intact and the retracement is worth watching. Whether you take it still depends on everything the strategy asks of a setup — where the zone lands, what’s happened already today, what’s on the calendar.
The opening lock
The dashboard forces NO TRADE for the first fifteen minutes of the New York session. That’s deliberate. The open produces violent moves that break structure and then immediately reverse, and taking a retracement into one of those is a fast way to get stopped for no reason.
The rule is: let the first fifteen minutes happen, then trade what’s left.
Reading the painted waves
Colour is doing real work here, and there are three of them.
| Colour | What it means |
|---|---|
| Strong bullish | A full-strength upward impulse that broke structure, with the higher-timeframe trend behind it |
| Strong bearish | The same to the downside |
| Weaker shade | A break that happened, but on a shorter, less convincing run of candles |
Only full-strength waves build a retracement. A weaker-coloured break is information — structure gave way — but the engine doesn’t treat it as a tradable impulse and won’t draw the levels for it.
There’s a second path to a strong wave: a counter-trend move large enough to matter. When price moves hard against the prevailing trend and covers enough ground relative to current volatility, the engine treats it as a genuine change of character rather than noise, and paints it. That’s the setup type that catches turns rather than continuations.
Volatility scales by instrument automatically. The distance a counter-trend move has to cover before it counts is measured in ATR, and the multiple adjusts depending on which contract you’re on — the Nasdaq contracts get a different one from everything else. The active value is printed on the dashboard so you can see which is in play.
The retracement
Once a wave completes, five levels are drawn across it: the two ends, the midpoint, and the two levels between them that the strategy is built around.
The zone between the two inner levels is where the strategy operates. The shallower of the two is the entry area — where a healthy retracement is expected to find buyers or sellers and continue. The deeper one is the line where the idea stops being valid: price closing through it means the impulse has been given back rather than digested.
A retracement that stalls in the zone is normal. Price entering the zone and then chopping sideways for a stretch is not the setup failing. It’s usually the opposite — it means the zone is being defended.
A retracement that slices straight through is the setup failing. The distinction is whether price pauses there or ignores it.
The zone should line up with something. The entry area landing on the 9, the 21 or VWAP is what makes a setup worth taking. If all three sit on the far side of the zone, price has to cut through every one of them to reach your entry — and that’s a setup to skip.
The full strategy — position sizing, targets, when to stop for the day, and the specific conditions that make a setup worth skipping — is in the strategy document in the members’ area. This page covers what the indicator draws and how to read it. The two are meant to be used together.
Sessions and the alert
The indicator knows three sessions — Asia, London and New York — and each can be switched on or off independently for alerting. The current one shows on the dashboard.
There is one alert condition: Any 5m BOS. It fires when a full-strength wave completes in a session you’ve enabled, and delivers a single message so you can put it on a chart and walk away.
The alert only fires on a 5-minute chart. That’s hard-coded. If you load the indicator on a 15-minute chart the levels and dashboard all work, but no alert will ever fire — worth knowing before you set one up and assume it’s watching.
What to run it on
Nasdaq futures — NQ and MNQ. That’s what the strategy was built and tested on, and it’s where the impulse structure is cleanest. The volatility scaling has a dedicated setting for those contracts for exactly that reason.
It will run on anything with volume, and the levels will draw. But the further you get from what it was tuned on, the less the wave detection means.
5-minute is the primary chart. 15-minute works for the same patterns at a larger scale, with the alert caveat above.
What this is and isn’t
It is an indicator, not a backtestable strategy. Despite the name, it plots structure and levels — it doesn’t place simulated orders, so there is no strategy tester report and no performance figures inside TradingView.
It doesn’t tell you to enter. It tells you a wave completed, draws the geometry, and reports whether that geometry is still intact. Every decision after that is yours.
It doesn’t manage the trade. No targets are drawn and no stops are placed. Those come from the strategy, not the script.
Settings
| Group | What it controls |
|---|---|
| Wave Colors | Bullish, bearish and weaker-displacement colours for the painted candles |
| Indicator Colors | The 9 EMA, 21 EMA and VWAP lines |
| Fibonacci Colors | Each retracement level, individually |
| Volatility Exception | The ATR multiple for Nasdaq contracts, and for everything else |
| Alert Session Filters | Asia, London and New York, each on or off |
| Auto Fib Settings | Show or hide the retracement |
| Dashboard Settings | Show or hide the dashboard |
The colours are worth setting deliberately. The whole tool communicates through them — three wave states, five retracement levels and three confluence lines. Braamskis recommends moving the candles away from red and green entirely, so the painted waves stand out against neutral bars rather than competing with them.
FAQ
The dashboard says NO TRADE but I can see a painted wave.
The wave hasn’t finished yet. The retracement only appears once the move completes and the first opposite candle prints — until then there’s nothing to measure. It’ll flip to VALID on that bar.
It went straight from VALID to INVALID without me doing anything.
Price ran beyond the extremes of the wave that created the setup. That overruns the move the retracement was measured from, so the geometry no longer describes anything. It resets to NO TRADE on the next bar and waits for a new wave.
Why is everything NO TRADE at the open?
The first fifteen minutes of the New York session are locked out deliberately — that window produces structure breaks that reverse immediately.
My alert never fires.
Check that you’re on a 5-minute chart — the alert is restricted to it — and that the session you’re trading is enabled in the alert filters.
What's the difference between the two bias rows?
The 10M row is the trend filter the engine actually uses. The 1H row is context, so you can see when the two disagree.
Can I run it on ES or gold?
It’ll draw. But it was built and tuned on the Nasdaq contracts, and the wave detection is calibrated for how those move.
Is there a backtest report?
No. It’s an indicator rather than a Pine strategy, so TradingView’s strategy tester doesn’t apply to it.
Where this fits
Every indicator in the engine is documented to the same standard.