
Built by Braamskis, included with TQE membership.
Overview
A read on which direction aggressive money is leaning on the index — inferred from dollar flow into the leveraged ETF pair rather than from the index itself.
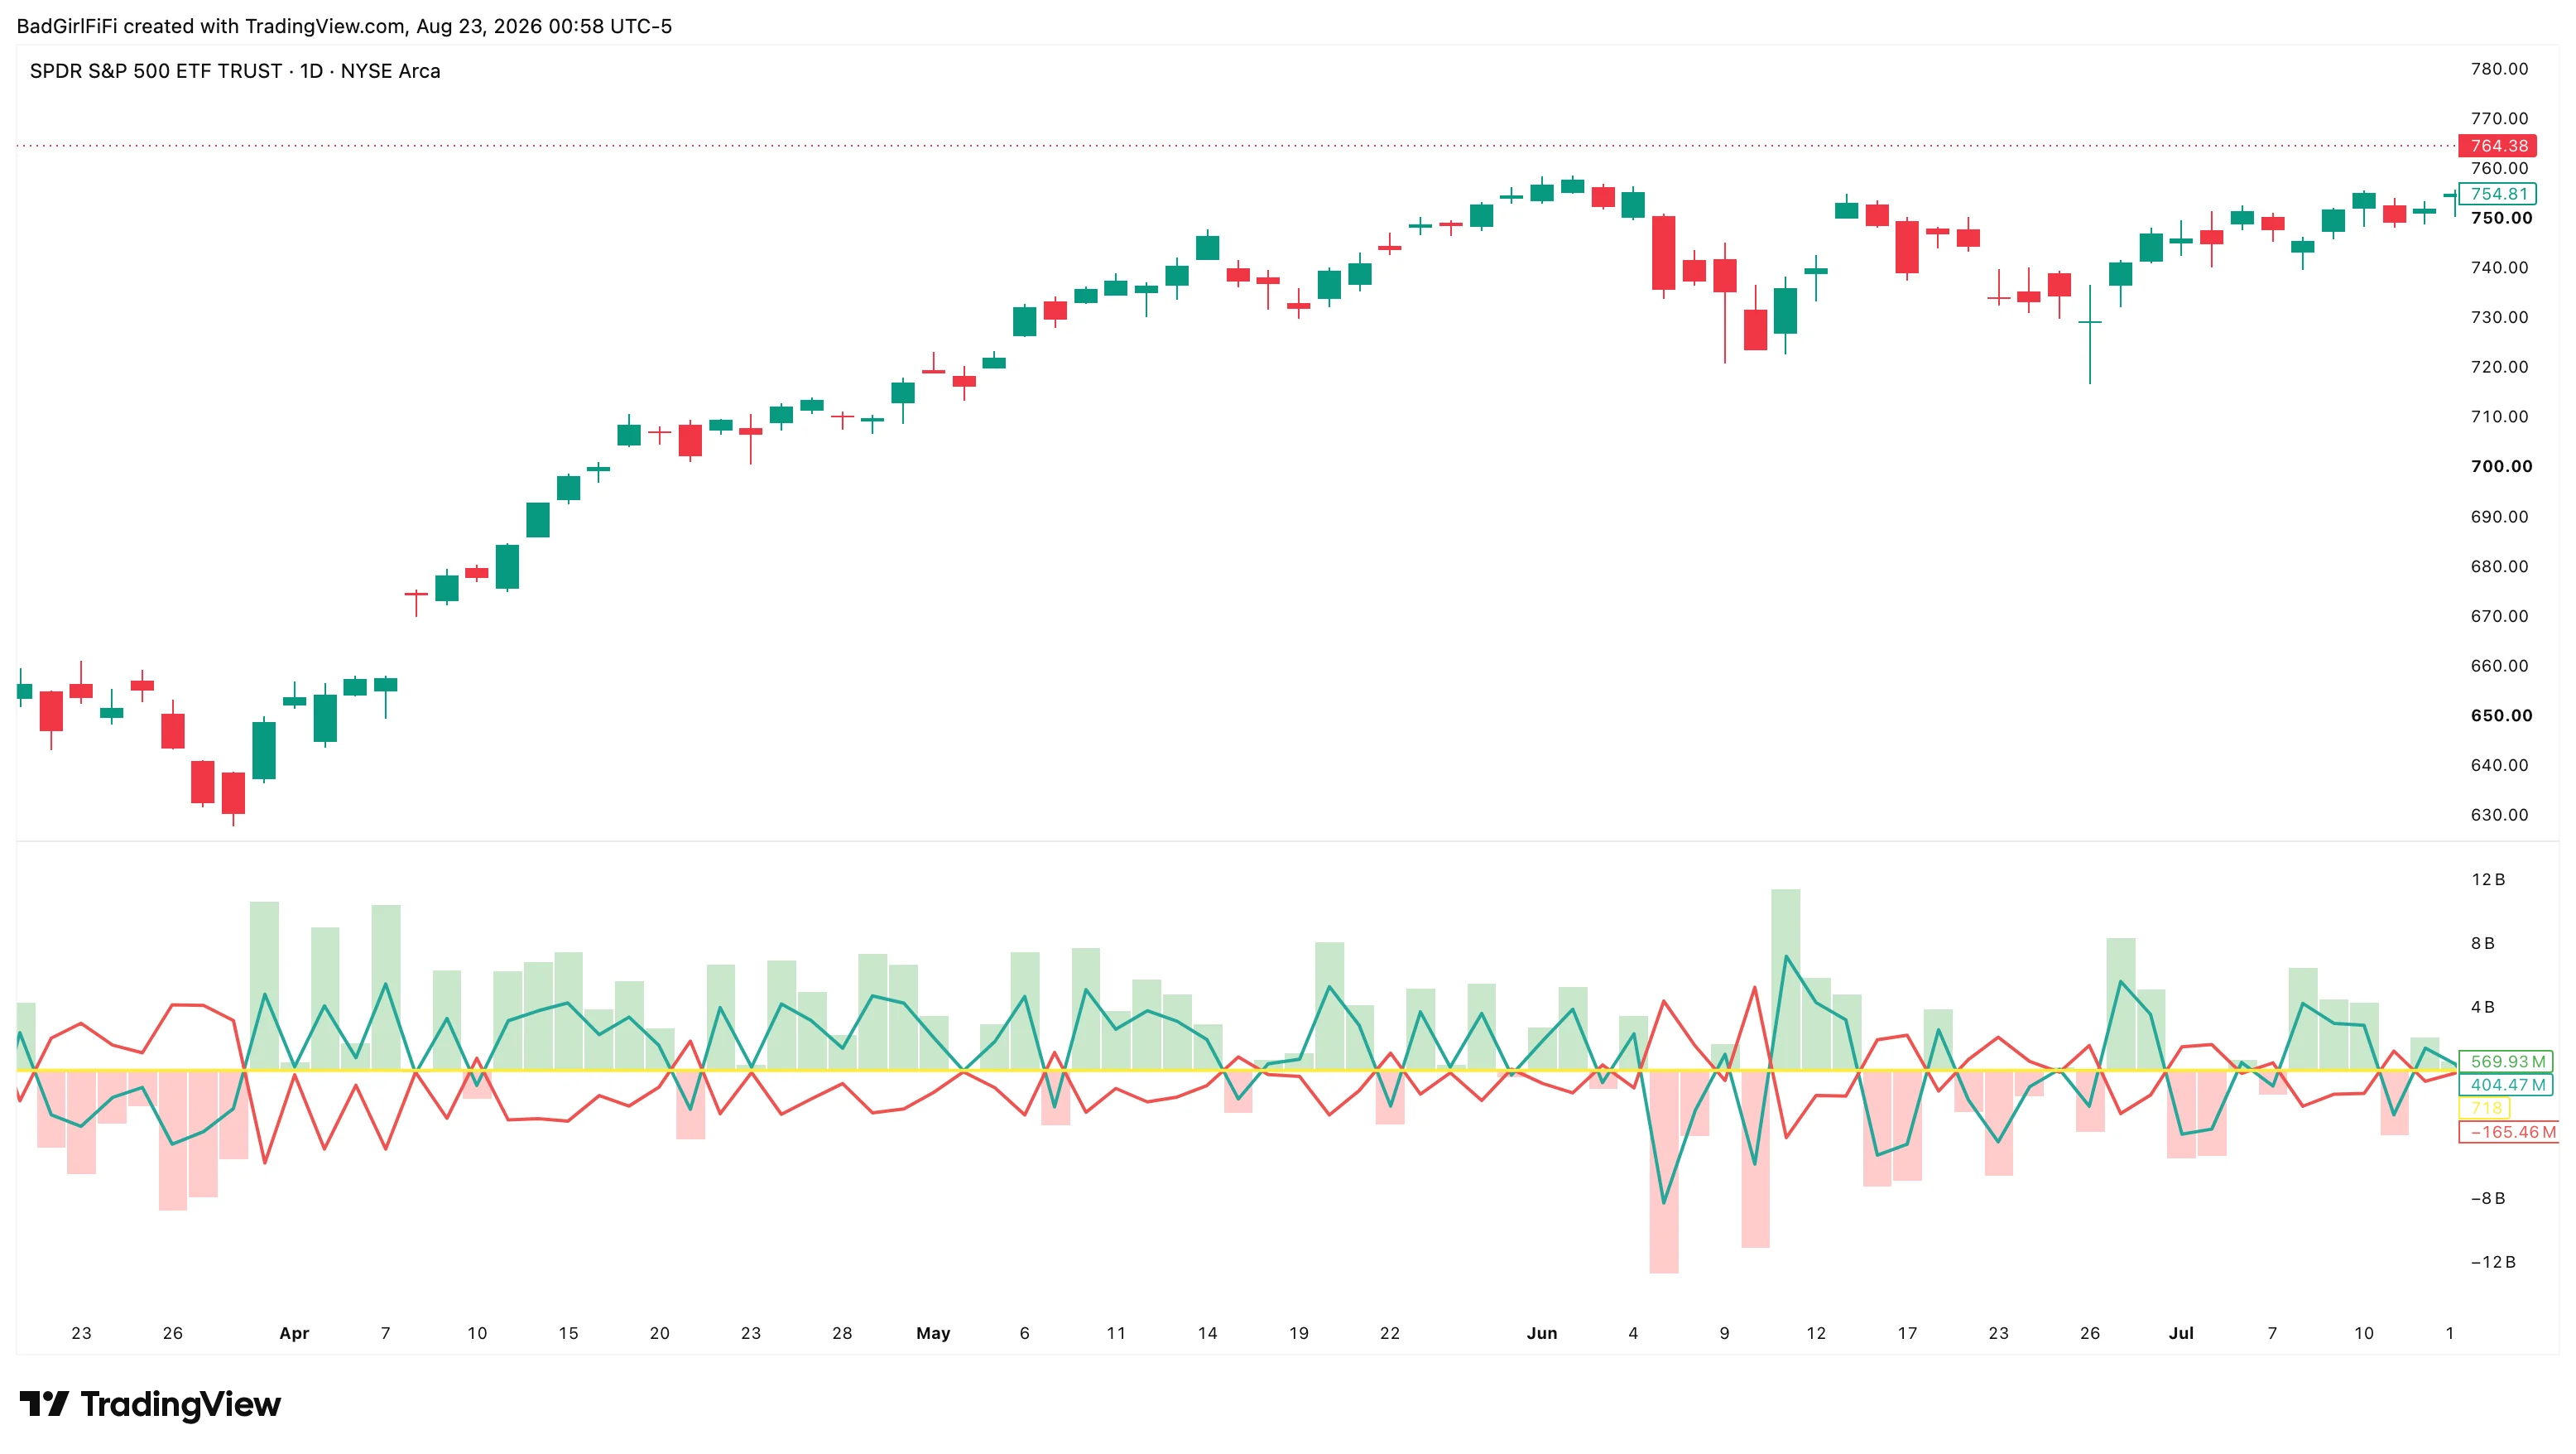 Green bars are net bullish flow, red bars net bearish. The two lines track each side’s accumulation separately.
It draws in its own pane below price.
Why leveraged ETFs
This is the idea the whole thing rests on.
Nobody buys TQQQ or SQQQ for a dividend, a hedge against a portfolio they already hold, or exposure they intend to keep for years. Those instruments exist for one purpose: a leveraged directional bet, right now.
That makes flow into them unusually clean. Money moving into the 3× bull fund is money paying up to be long. Money into the 3× bear fund is money paying up to be short. Aggregate both, net them off, and you have a reasonable estimate of which way conviction is pointing — without needing an options feed.
| Target | Bull fund | Bear fund |
|---|---|---|
| QQQ | TQQQ | SQQQ |
| SPY | SPXL | SPXS |
How the flow is estimated
Each fund’s bars are converted into a dollar-denominated directional figure — a proprietary per-bar estimate of how much money was committed, and to which side. Normalising to dollars is what makes the bull fund and the bear fund comparable despite trading at completely different prices.
Bull flow and bear flow accumulate separately through the session, and the net is bull minus bear.
Reading the panel
| Element | What it is |
|---|---|
| Green bars | Net flow favouring the upside |
| Red bars | Net flow favouring the downside |
| Two lines | Each side’s accumulation, tracked separately |
The separate lines matter more than the net. Net zero can mean two very different things — nobody trading either side, or both sides pressing hard against each other. The first is apathy, the second is a fight, and only the individual lines tell them apart.
From the chart above: bull flow of 569.93M against bear flow of −165.46M nets to 404.47M. Long side clearly in control, and not because the short side was absent.
It resets every session
Accumulation restarts at each new day. That’s what makes the intraday reading meaningful — you’re seeing today’s positioning build, not a running total dragging weeks of history behind it.
Which also means it’s an intraday tool. On a daily chart each bar shows one session’s total rather than anything accumulating, which is still readable but isn’t what it was built for.
Two things to know
The asset selection is independent of your chart. The indicator measures whichever target you pick in the settings — QQQ or SPY — regardless of what symbol you have open. In the screenshot above it’s running on a SPY chart while set to QQQ. Match them, or know why you haven’t. Reading QQQ flow against SPY price is a legitimate thing to do deliberately and a confusing thing to do accidentally.
It’s a proxy, and the name says so. This is not true order-flow delta — there’s no bid/ask tape here. It’s flow estimated from price and volume behaviour rather than measured from the tape. That estimate is good enough to show you which side is leaning, and not precise enough to treat as a measurement. Use it for direction and conviction, not for a number.
Using it
Confirmation, not a trigger. A breakout with net flow pushing the same way has real directional money behind it. The same breakout while flow leans the other way is being sold into.
Watch for divergence. Price making a new high while net flow shrinks is the interesting case — the move is continuing but the money paying for it is thinning out.
Watch the two lines, not just the bars. Both sides accumulating hard is a market in disagreement, and disagreements resolve violently.
Settings
| Setting | Default | What it does |
|---|---|---|
| Target Index / Asset | QQQ | QQQ or SPY — selects which leveraged pair is measured |
The pane is volume-formatted, so the axis reads in millions and billions of dollars rather than raw numbers.
FAQ
Does it read my chart symbol?
No. It measures the target you select in the settings. Set it to match what you’re looking at.
Is this real options premium?
No — it’s a proxy built from leveraged ETF flow. There’s no options feed involved.
Why leveraged ETFs rather than the index itself?
Index volume contains hedging, rebalancing and long-term allocation. Leveraged ETF volume is almost purely short-term directional bets, which is what you’re trying to measure.
Which timeframe?
Intraday. Accumulation resets each session, so 1 to 60 minutes is where it’s designed to work.
The net is near zero. Is nothing happening?
Check the two lines. Zero net with both sides small means nobody is committing. Zero net with both sides large means a genuine fight.
Can I point it at other assets?
Only QQQ and SPY — those are the pairs it’s wired for.
Where this fits
Every indicator in the engine is documented to the same standard.