
Built by Braamskis, included with TQE membership.
Overview
A live position-size calculator that answers the only question that matters before you press the button: how many shares?
It sizes off the low of day as the stop, converts your risk percentage into a dollar figure, and divides. Six numbers, updating tick by tick.
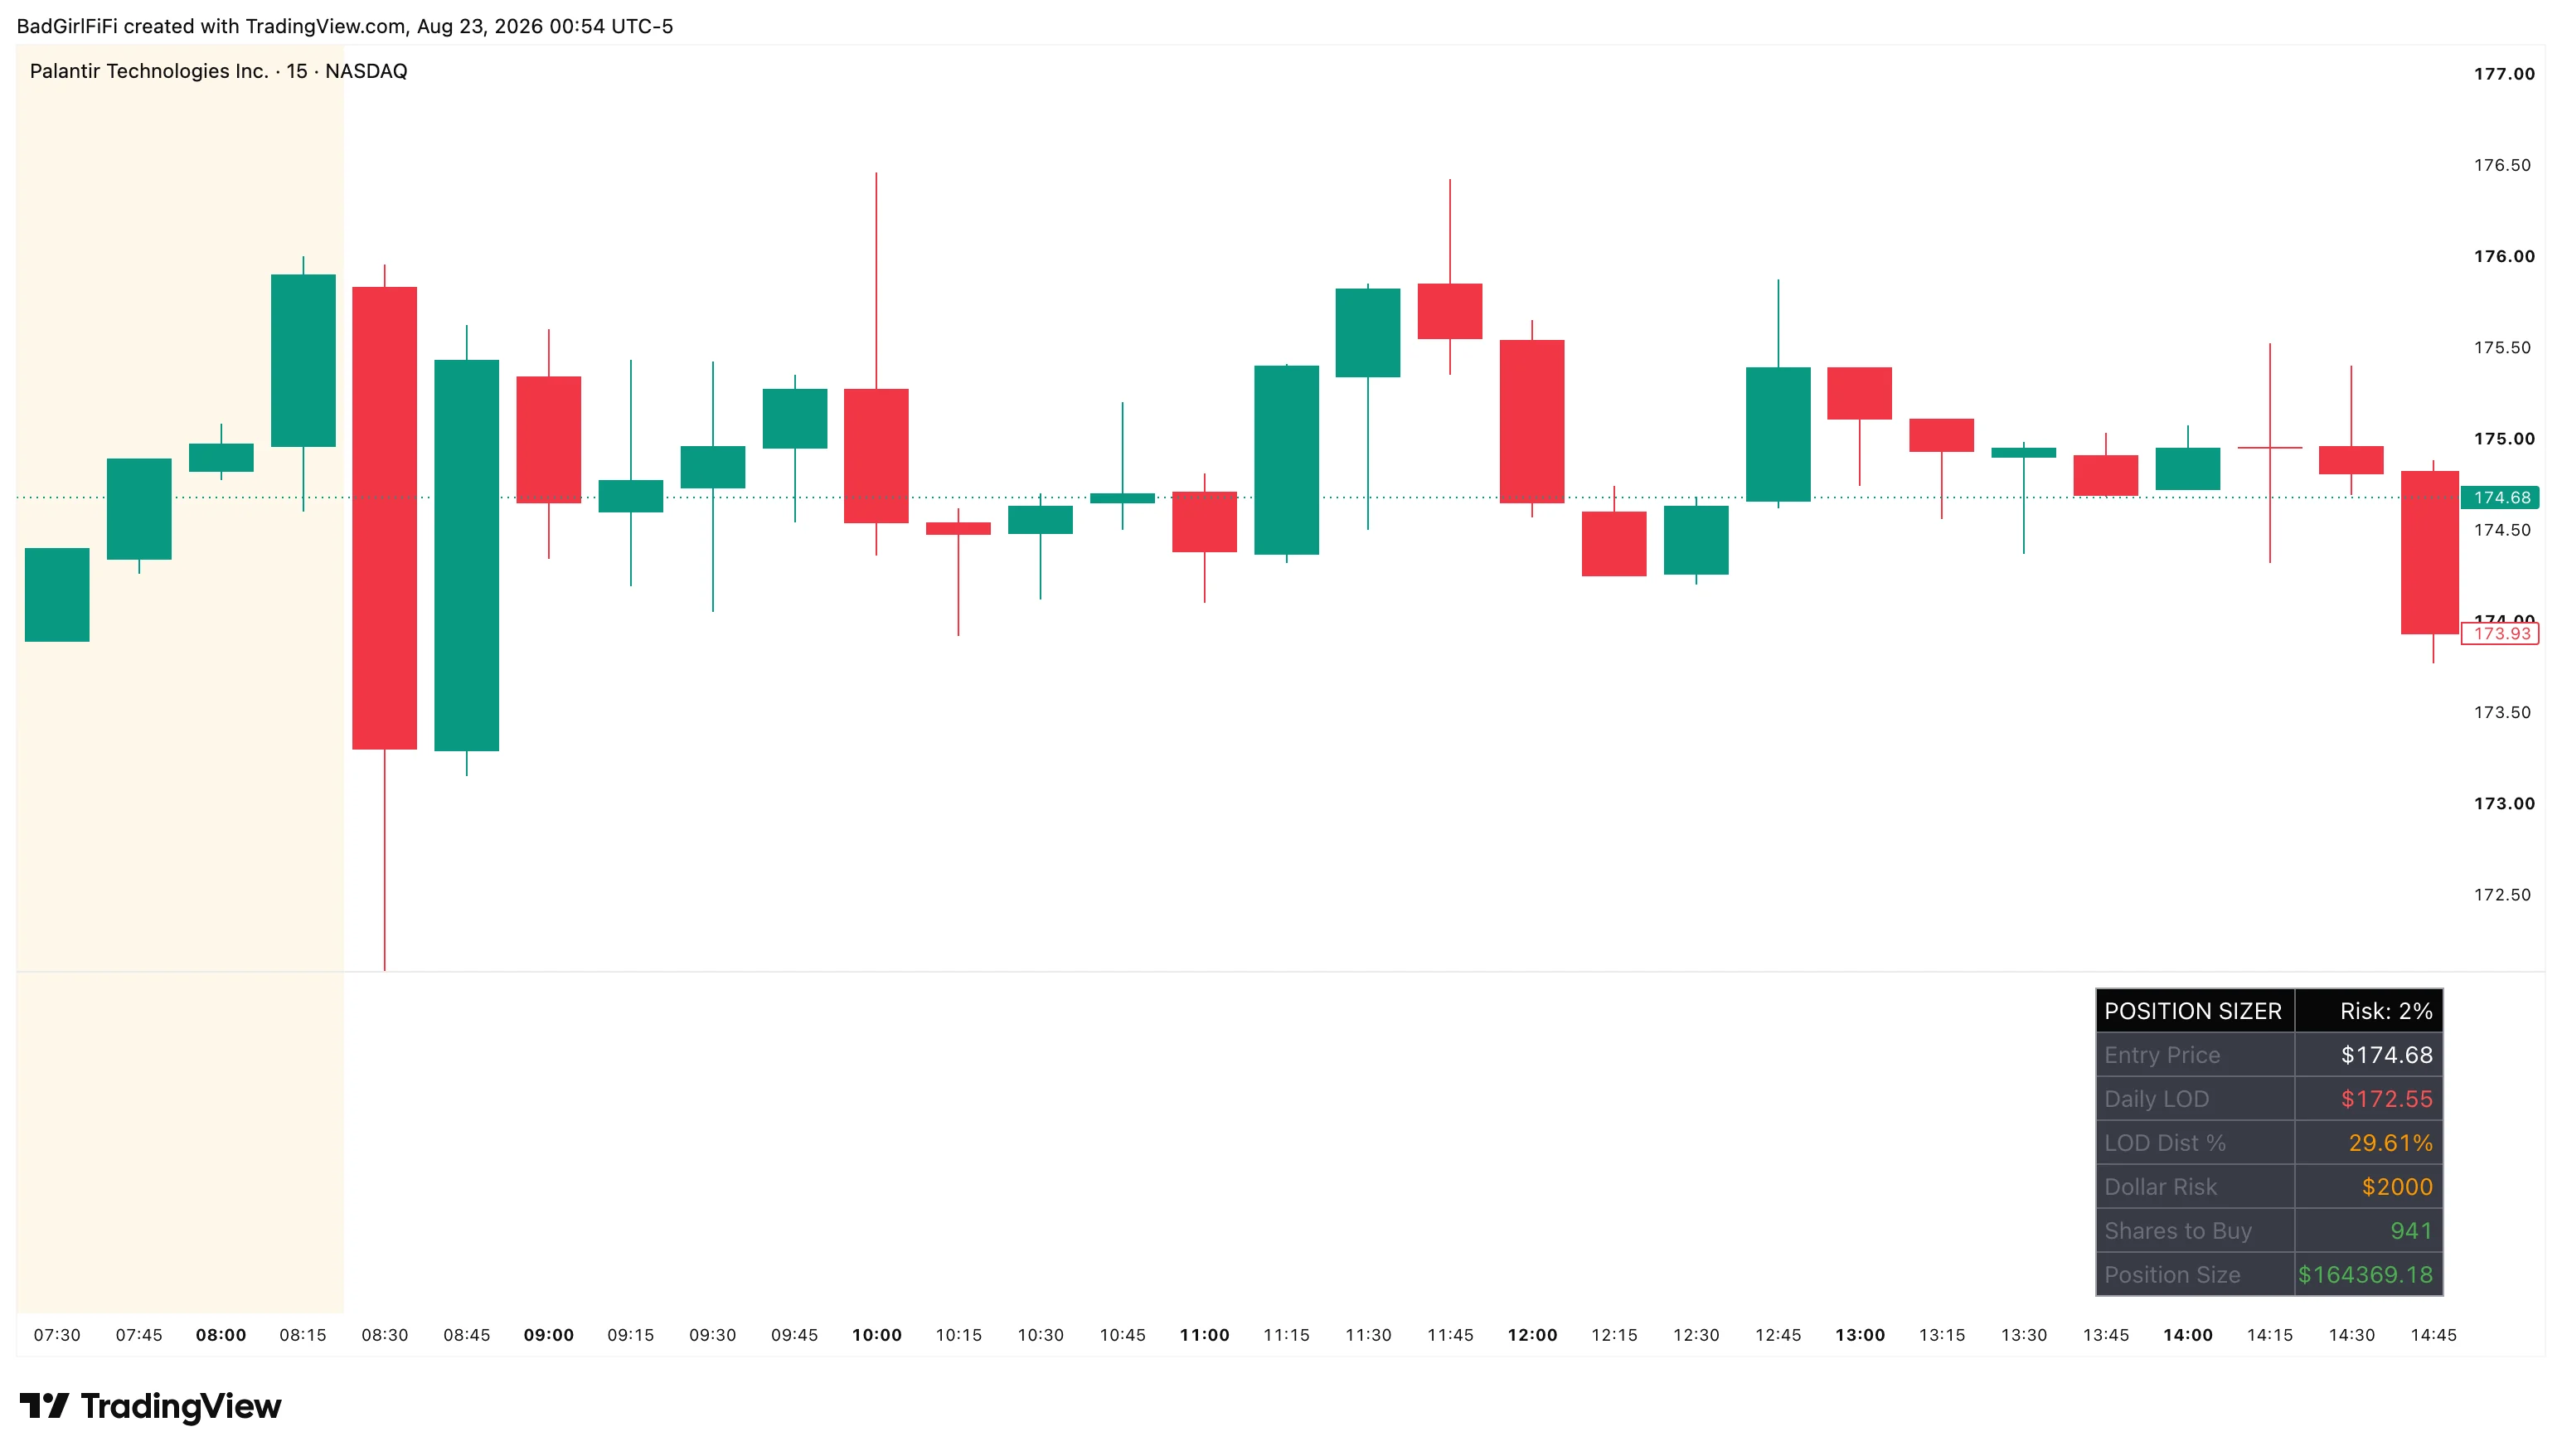 The panel sits in its own pane below price. Everything recalculates as price moves.
It draws in a separate pane, not on the chart — so it never covers price action.
What the panel shows
| Row | What it is |
|---|---|
| Entry Price | Current price — where you’d be getting in |
| Daily LOD | The low of day, which is where the stop goes |
| LOD Dist % | How far that stop is, as a percentage of average daily range |
| Dollar Risk | Your account equity × your risk percentage |
| Shares to Buy | Dollar risk ÷ distance to the LOD |
| Position Size | Shares × entry price |
Worked example
From the chart above — a $100,000 account at 2% risk:
| Value | |
|---|---|
| Entry | $174.68 |
| Low of day | $172.55 |
| Distance to stop | $2.13 |
| Dollar risk | 2% of $100,000 = $2,000 |
| Shares | $2,000 ÷ $2.13 = 941 |
| Position size | 941 × $174.68 = $164,369 |
Every figure follows from the two above it. Nothing is hidden.
The stop is the low of day
That’s the model, and it’s worth being explicit about because it constrains everything.
This sizer assumes you’re long and your stop is the day’s low. It doesn’t ask you where your stop is — it reads it from the chart. That makes it fast and removes a decision, which is the point, but it also means the tool only fits a strategy where the LOD is your invalidation.
If your stop is a moving average, a prior pivot, or a fixed percentage, the share count here won’t match your plan.
LOD Dist % is the row people skip
It’s the most useful number in the panel.
It expresses the distance to your stop as a percentage of the average daily range. In the example it reads 29.61% — the stop sits about a third of a typical day’s movement away.
| Reading | What it tells you |
|---|---|
| Low | The stop is close. Big share count, and price only has to breathe wrong to hit it |
| Around 30–50% | A stop a normal day’s movement can respect |
| High | You’re risking most of a day’s range per share. The position will be small, and it should be |
A very low reading is a warning, not a gift. Price sitting a few cents above the low of day produces an enormous share count, because the maths divides by a tiny number. That isn’t a great entry — it’s an entry with no room.
Risk tiers
By default you set one Risk % per Trade and it applies to everything.
Switch on Setup Tier Presets and you get three, which override that number:
| Tier | Default risk |
|---|---|
| A+ | 2% |
| A | 1% |
| B | 0.5% |
The idea is that conviction should change size, and it should change it by a rule rather than a mood. An A+ setup gets four times the risk of a B — decided in advance, in the settings, rather than in the moment with the order ticket open.
All three percentages are adjustable.
Two things to watch
The position size is not capped by your buying power. In the worked example, a $100,000 account produces a $164,369 position — 1.6× equity, because the stop was tight enough that 2% risk bought that many shares. The calculator sizes purely from risk; it doesn’t know or care what you can actually afford. Check the position size row, not just the share count.
Historical readings aren’t what you’d have seen live. The panel always reads the session’s true low, which is correct for a live tool — right now, the low of day is the low of day. But scroll back and the panel shows each day’s eventual low, including moves that hadn’t happened yet at that point in the session. Use it in real time. Don’t study it historically and conclude anything about what the numbers would have been.
Settings
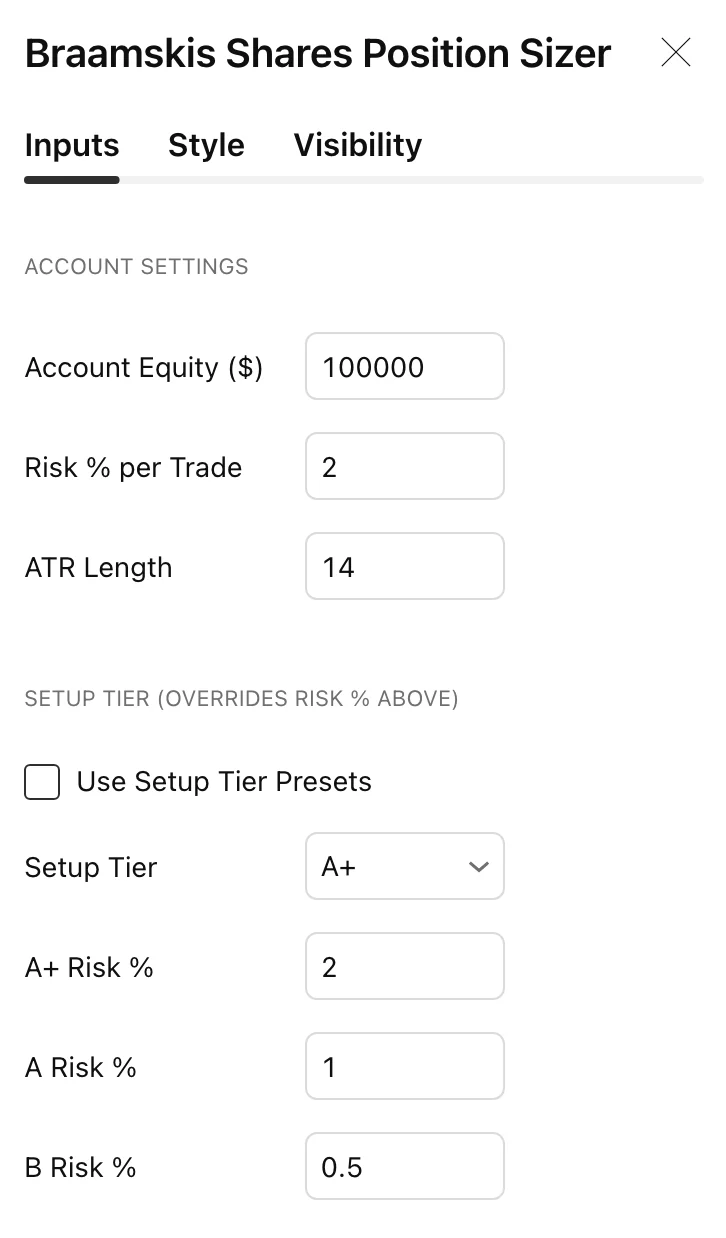
| Setting | Default | What it does |
|---|---|---|
| Account Equity ($) | 100,000 | Drives the dollar risk figure |
| Risk % per Trade | 2 | Percentage of equity risked, when tiers are off |
| ATR Length | 14 | The average range behind LOD Dist % |
| Use Setup Tier Presets | Off | Switches to the three-tier model |
| Setup Tier | A+ | Which tier is active |
| A+ / A / B Risk % | 2 / 1 / 0.5 | Risk per tier |
| Table Position | Top Right | Nine positions within the pane |
FAQ
Where does the panel appear?
In its own pane below price, not over the chart.
Can I set my own stop instead of the low of day?
Not in this one — the LOD is the stop. If your invalidation is elsewhere, the share count won’t match your plan.
Does it work for shorts?
It’s built around a long from above the day’s low. Shorts would need the high of day as the stop.
Why is the share count enormous?
Price is close to the low of day, so the distance to the stop is tiny and the division produces a large number. Check LOD Dist % — a very low reading means an entry with no room.
Why is the position size bigger than my account?
Because a tight stop lets a small risk percentage buy a lot of shares. The calculator doesn’t cap by buying power. Read the position size row before acting.
Which timeframe should I run it on?
Any. It reads the daily low and daily ATR regardless of your chart.
Where this fits
Every indicator in the engine is documented to the same standard.