
Overview
A countdown to the current candle’s close, floating beside price, counting in plain seconds — and changing colour as the close approaches.
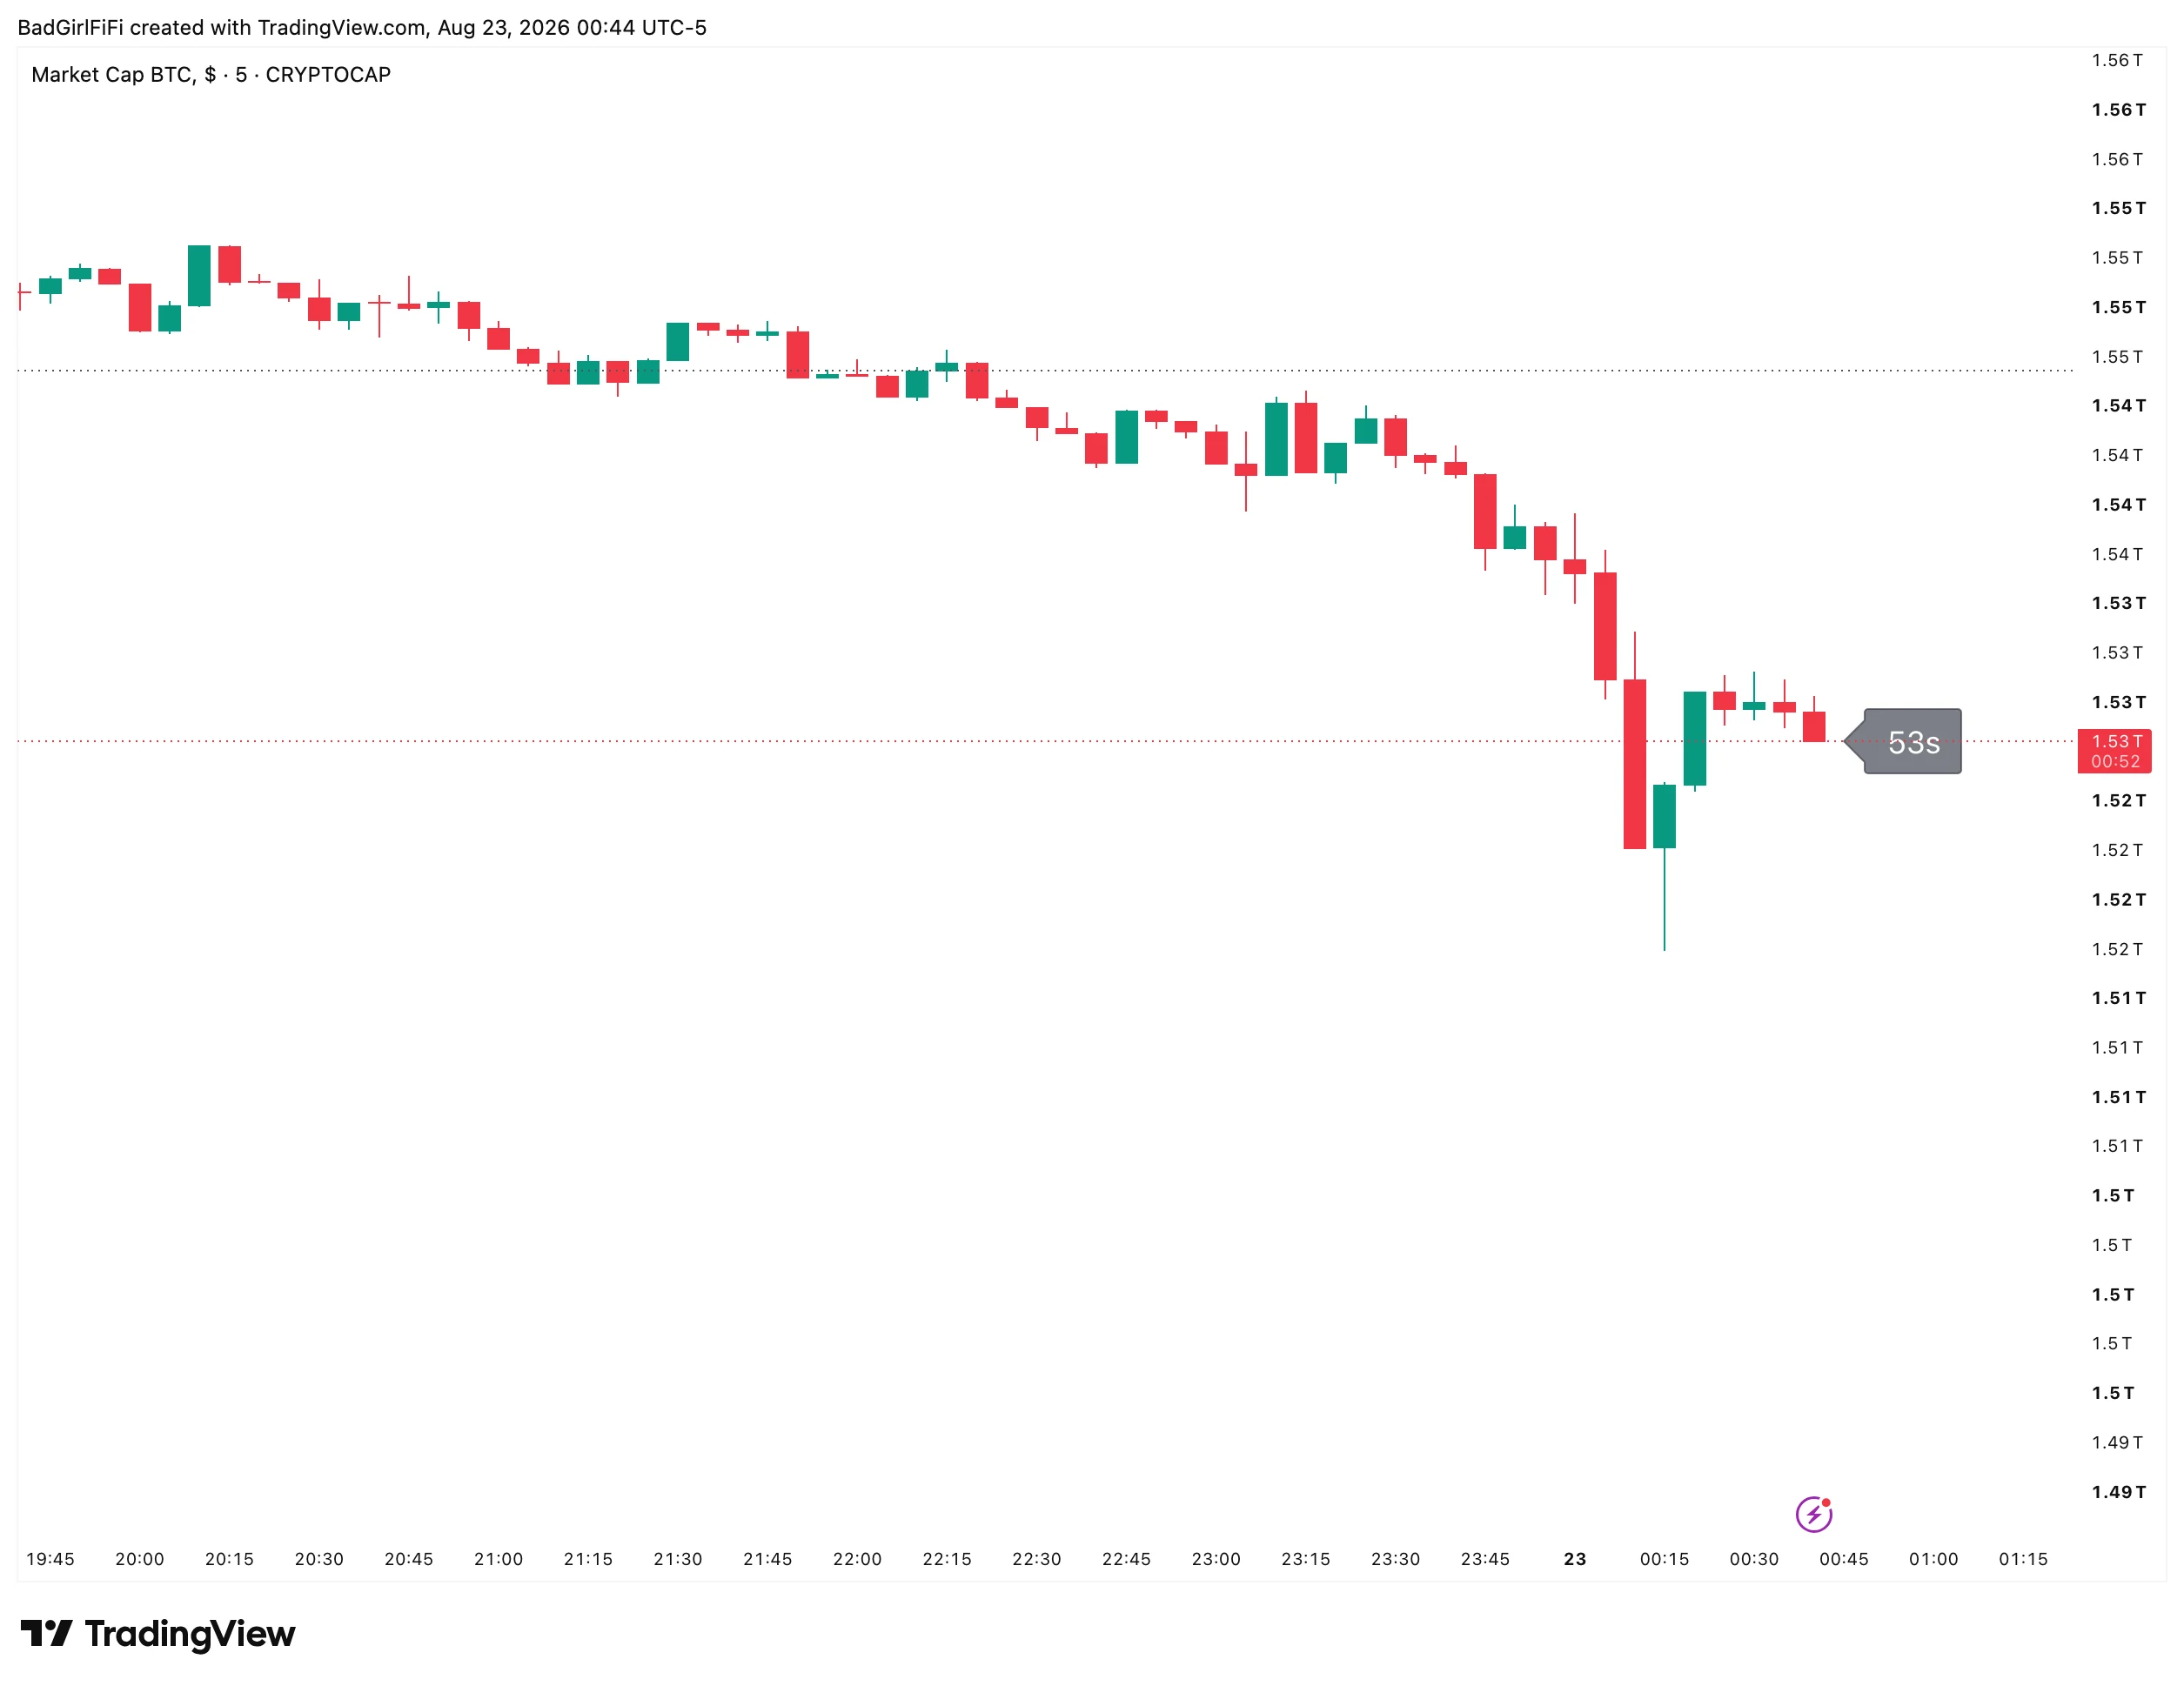 Fifty-three seconds left on this bar. The bubble sits at price, at the right edge, where you’re already looking.
Why it exists
Almost every confirmation rule in this suite is a bar-close rule. Trend Spine tags confirm on the close of the following bar. The 9EMA/VWAP exit is defined by where a candle opens and closes. Alert frequency guidance throughout is “Once Per Bar Close.”
If your decisions are made on closes, then knowing exactly when the close happens isn’t a nicety — it’s the difference between acting on a confirmed bar and acting on a bar that still has ninety seconds to change its mind.
TradingView already has a countdown, tucked into the price axis in small monochrome type. This one is large, sits beside price rather than off in the scale, and — the part that matters — changes colour.
Seconds only, on purpose
The bubble counts raw seconds. Not 4:53. Just the number.
That’s deliberate. In the final minute — the only part of the countdown you actually act on — a mm:ss display makes you do arithmetic at exactly the moment you don’t want to. 12 is instant. 0:12 is a conversion.
Urgency colours
The real feature. The countdown changes colour as it runs out:
| State | Default | Meaning |
|---|---|---|
| Normal | White | Plenty of time |
| Warn | Orange | 10 seconds or fewer |
| Hot | Red | 5 seconds or fewer |
You’re not meant to read it. You’re meant to notice it out of the corner of your eye while you’re looking at price. A white bubble is background; an orange one pulls your attention back; a red one means decide now.
Both thresholds are adjustable. On a 1-minute chart you might drop them; on a daily, raise them so the warning covers the last few minutes of the session.
Placement
The bubble anchors to price and follows it, so it stays where your eyes already are.
| Setting | Default | What it does |
|---|---|---|
| X Offset (bars) | 1 | How far right of the last bar it sits |
| Y Offset (ATR multiples) | 0 | 0 puts it at price. 0.5 floats it above |
| Anchor at Candle Mid | Off | Anchor to the candle’s midpoint instead of its close |
| Text Size | Large | Tiny through Huge |
| Background Bubble | On | The pill behind the number |
| Background Transparency | 35 | 0 is solid, 100 invisible |
| Text / Bubble colour | White on black | Base colours before urgency takes over |
| Enable urgency colours | On | The orange and red states |
| Warn at / Hot at (seconds) | 10 / 5 | The two thresholds |
| Warn / Hot colour | Orange / red |
The Y Offset is worth adjusting. At 0 the bubble sits on the last close, which can overlap price action on a busy chart. Setting it to 0.5 floats it half an ATR above — clear of the candles, still in the same visual space. Because it’s measured in ATR rather than points, the same setting works on a $4 stock and a $900 one.
FAQ
Which timeframe?
Any. It reads the current bar’s close time, so it works identically on a 1-minute chart and a daily.
On a daily chart it shows a huge number.
It counts every second to the close, so a daily bar reads in the tens of thousands. It’s most useful intraday — on higher timeframes, raise the warn and hot thresholds so the colour change does the work instead.
Can I make it show minutes and seconds?
No — seconds only is the design. See above.
It's overlapping my candles.
Raise the Y Offset to 0.5, or increase the X Offset to push it further right.
Does it affect anything else on my chart?
No. It draws one label and calculates nothing else. Leave it loaded.
Ready for the full engine?
This one is free. The Trade Qualification Engine is the paid suite it was built alongside.