
Overview
FiFi — Multi-TF EMA plots daily and weekly exponential moving averages directly onto your intraday chart. Drop to a 5, 10, or 15-minute chart and the daily 8, 21, and 50 EMAs stay on screen in their true positions, along with the weekly 8 and 21 — so you always know where the key levels are while you’re working the timeframe you actually execute on.
Five core EMAs are included and enabled by default:
| Line | Timeframe | Length | Default color |
|---|---|---|---|
| 8D | Daily | 8 | Teal |
| 21D | Daily | 21 | Orange |
| 50D | Daily | 50 | Red |
| 8W | Weekly | 8 | Lime |
| 21W | Weekly | 21 | Purple |
Two additional custom slots let you add whatever else your process uses — EMA or SMA, any length, on the daily or weekly. A 200-day SMA, a 34-week EMA, a 50 SMA alongside the built-in 50 EMA.
Each visible line carries a label on the right edge of the chart so you can identify levels at a glance without hovering or counting colors. Every line also has its own touch alert.
The problem it solves is a common one: the levels that actually turn price live on the daily and weekly charts, but execution happens down on the 5 or 15 minute. Switching up to check where the 21D sits, then switching back, costs you the level and the moment. This keeps both on one screen.
The goal isn’t to trade an EMA by itself. Use the overlay to quickly understand trend, location, and confluence, so you can make better decisions across multiple timeframes from a single chart.
Who it’s for
Day traders. Use the Daily 8, 21, and 50 EMAs to understand the larger trend and identify important areas where price may react intraday — especially where an EMA lines up with other levels you’re already watching.
Swing traders. Use the Daily and Weekly EMAs together to identify trend, pullback zones, and potential continuation or breakdown areas.
Either way, the point is the same: see higher-timeframe trend and key dynamic support and resistance without constantly switching charts.
Adding it to your chart
New to adding indicators on TradingView? Start with the setup guide, then come back here.
Once it’s on your chart, the five core EMAs appear immediately with no configuration required. The defaults are the intended setup — start there and adjust only if your process calls for different lengths.
Which chart timeframe to use it on. Lower timeframes are where this earns its keep. The 5, 10, and 15-minute charts are the primary use case: you get precise entries while the daily and weekly levels sit right there on the same screen. It works equally well on the 1H and 4H, and on the daily itself for weekly context.
The only place it doesn’t belong is above the daily. On a weekly or monthly chart it would be requesting lower-timeframe data, which isn’t what it was built to do.
This one stays on my chart. No matter what timeframe I’m on, it’s loaded. It gives me situational awareness of where these EMA levels sit across every timeframe at once — so I’m never trading a 5-minute chart blind to what the daily and weekly are doing.
Settings reference
Core EMAs
All five are on by default. Turn off what you don’t use — fewer lines is almost always the better chart.
| Setting | Default | What it does |
|---|---|---|
| Show Daily 8 EMA (8D) | On | Fastest daily average |
| Show Daily 21 EMA (21D) | On | Intermediate daily average |
| Show Daily 50 EMA (50D) | On | Slower daily trend reference |
| Show Weekly 8 EMA (8W) | On | Fast weekly average |
| Show Weekly 21 EMA (21W) | On | Intermediate weekly average |
Important: turning off an EMA also disables its alert. If you’ve set an alert on the 21D and later hide the line, the alert stops firing silently.
Custom MAs (2 slots)
Both are off by default. Each slot is fully independent — type, timeframe, and length.
| Setting | Default | What it does |
|---|---|---|
| Show Custom 1 | Off | Enables slot 1 |
| Custom 1 TF | D |
Daily or Weekly |
| Custom 1 Type | EMA | EMA or SMA |
| Custom 1 Length | 34 | Period, minimum 1 |
| Custom 1 Label | 34D |
Text shown on the right-side label |
| Show Custom 2 | Off | Enables slot 2 |
| Custom 2 TF | W |
Daily or Weekly |
| Custom 2 Type | EMA | EMA or SMA |
| Custom 2 Length | 13 | Period, minimum 1 |
| Custom 2 Label | 13W |
Text shown on the right-side label |
The label is manual. Changing the length or the type does not update it — set a slot to 200 SMA and the label still reads whatever you last typed. Update both together, or the chart will lie to you.
Recommended custom setup A 200 SMA and a 50 SMA on the daily, filling both slots. Running the 50 SMA alongside the built-in 50 EMA is deliberate — the gap between them shows you how much recent price action is pulling the average around, and institutions watch the simple 200 far more than the exponential one.
MA Colors
One color picker per line: 8D, 21D, 50D, 8W, 21W, Custom 1, Custom 2. Defaults are teal, orange, red, lime, purple, blue, and fuchsia respectively.
Style
| Setting | Default | Range | What it does |
|---|---|---|---|
| Line Width | 2 | 1–5 | Thickness of all EMA lines |
| Show Right-Side Labels | On | — | Master switch for the labels |
| Label Offset (bars) | 2 | 0–50 | How far right of the last bar labels sit |
| Label Size | Small | Tiny / Small / Normal | Label text size |
| Label BG Transparency | 70 | 0–100 | 0 is solid, 100 is invisible |
Labels render only at the right edge of the chart, on the most recent bar. They follow the current EMA value and update live.
Alerts
| Setting | Default | What it does |
|---|---|---|
| Enable MA Alerts | On | Master switch — off means no alert fires regardless of what you’ve configured in TradingView |
| Touch Mode | Wick Touch | How a touch is defined — see below |
| ATR Length | 14 | Length of the ATR used to size the Approaching alerts |
| Approach Distance (ATR) | 0.15 | How close counts as approaching, in ATR — 0.15 is within 15% of one ATR |
| Close Touch Tolerance (ticks) | 2 | How close a close must be to count as a touch. Close Touch mode only |
Why Approach Distance is measured in ATR
A fixed distance doesn’t work across symbols. Twenty cents is a meaningful approach on a $30 stock and noise on a $900 one. ATR scales the zone to how much the symbol actually moves, so 0.15 means the same thing on every chart: price has come within 15% of one average daily range of the line.
Raise it if you want earlier warning, lower it if you’re getting told too soon.
Reading the signals
This is a levels indicator, not a signal generator. It doesn’t tell you to buy or sell — it tells you where price sits relative to daily and weekly structure.
The lines work in both directions. A moving average below price is potential support; the same average above price is potential resistance. Nothing about the indicator is biased long — the 21D you buy pullbacks into on Monday is the 21D you short into on Thursday. What changes is which side of it price is on.
That two-sidedness is most of the value on a low timeframe. When a stock gaps and runs, the 5-minute chart has no structure overhead — no prior range, no visible pivot, nothing to say where the move should run out of room. The daily and weekly averages are the only overhead reference that exists, and they’re already on your chart.
How price treats a level is itself the read. Stalling at the first average it reaches is one kind of information. Cutting through several stacked averages without pausing at any of them is a completely different kind — that’s demand overwhelming every layer of supply those levels represent. It doesn’t put you long at the highs, but it takes the short off the table and makes the next pullback into the nearest EMA worth watching.
Both examples below are the same indicator on the same timeframe, saying opposite things.
Trend: which side of the EMAs is price on?
Trading above the major EMAs generally favors long setups. Trading below them generally favors shorts. That’s the first read, and it takes a second.
Tests and reclaims of a level provide additional confluence for an entry.
Confluence is the whole point
An EMA on its own is a line. An EMA that lines up with something else you’re already watching is a location.
Intraday, that means an EMA sitting on or near:
- The previous day’s high or low (PDH / PDL)
- VWAP
- The opening range
When two or three of those stack in the same few cents, that’s an area where price is far more likely to react. The overlay’s job is to show you when a daily or weekly average has landed in one of those spots — which you’d otherwise only find by flipping timeframes and hoping you noticed.
Which EMAs matter, and when
Shorter-term trends: the Daily 8 and 21. Strong stocks will often respect these closely. In an established move, pullbacks into the 8D or 21D are the normal continuation locations.
Deeper pullbacks: the Daily 50 and the Weekly 8 and 21. When a move gives back more than a shallow pullback, these become the more significant support or resistance. This is where a swing thesis is usually decided.
Compressed lines mean no trend. When the daily EMAs bunch tightly together, a touch of any single one carries much less information — and the touch alerts will fire constantly.
Setting up alerts
Seven alert conditions are available, one per line:
| Alert name | Message |
|---|---|
| Touch 8D | Price touched 8D EMA |
| Touch 21D | Price touched 21D EMA |
| Touch 50D | Price touched 50D EMA |
| Touch 8W | Price touched 8W EMA |
| Touch 21W | Price touched 21W EMA |
| Touch Custom 1 | Price touched Custom MA 1 |
| Touch Custom 2 | Price touched Custom MA 2 |
| Approaching 8D | Price approaching 8D EMA |
| Approaching 21D | Price approaching 21D EMA |
| Approaching 50D | Price approaching 50D EMA |
| Approaching 8W | Price approaching 8W EMA |
| Approaching 21W | Price approaching 21W EMA |
| Approaching Custom 1 | Price approaching Custom MA 1 |
| Approaching Custom 2 | Price approaching Custom MA 2 |
Approaching vs Touch. Touch tells you price is at the line — by then you’re watching a reaction that’s already started. Approaching tells you it’s getting close, which is when you’d actually want to pull the chart up and get ready.
Approaching fires once, on the bar price first enters the zone, not on every bar of the walk toward the level. It also excludes bars that are already touching, so you never get both alerts on the same bar.
To create one: right-click the chart → Add alert → set Condition to FiFi — Multi-TF EMA, then pick the touch condition you want.
Touch Mode changes what counts as a touch:
- Wick Touch (default) — fires when the EMA falls anywhere inside the bar’s high-low range. Catches every genuine tag, including wicks that reject instantly.
- Close Touch — fires only when a bar closes on the line, within the tick tolerance you set. Far fewer alerts, and each one means price actually accepted at the level rather than just wicking through it. Widen the tolerance on volatile or high-priced symbols.
Set the alert to “Once Per Bar Close.” A touch condition is true on every bar where price is at the line. On a 5-minute chart, price hovering near the 21D EMA will fire on bar after bar if you leave the frequency at “Once Per Bar.”
Example setups
Shorting into daily resistance — MU, 5-minute
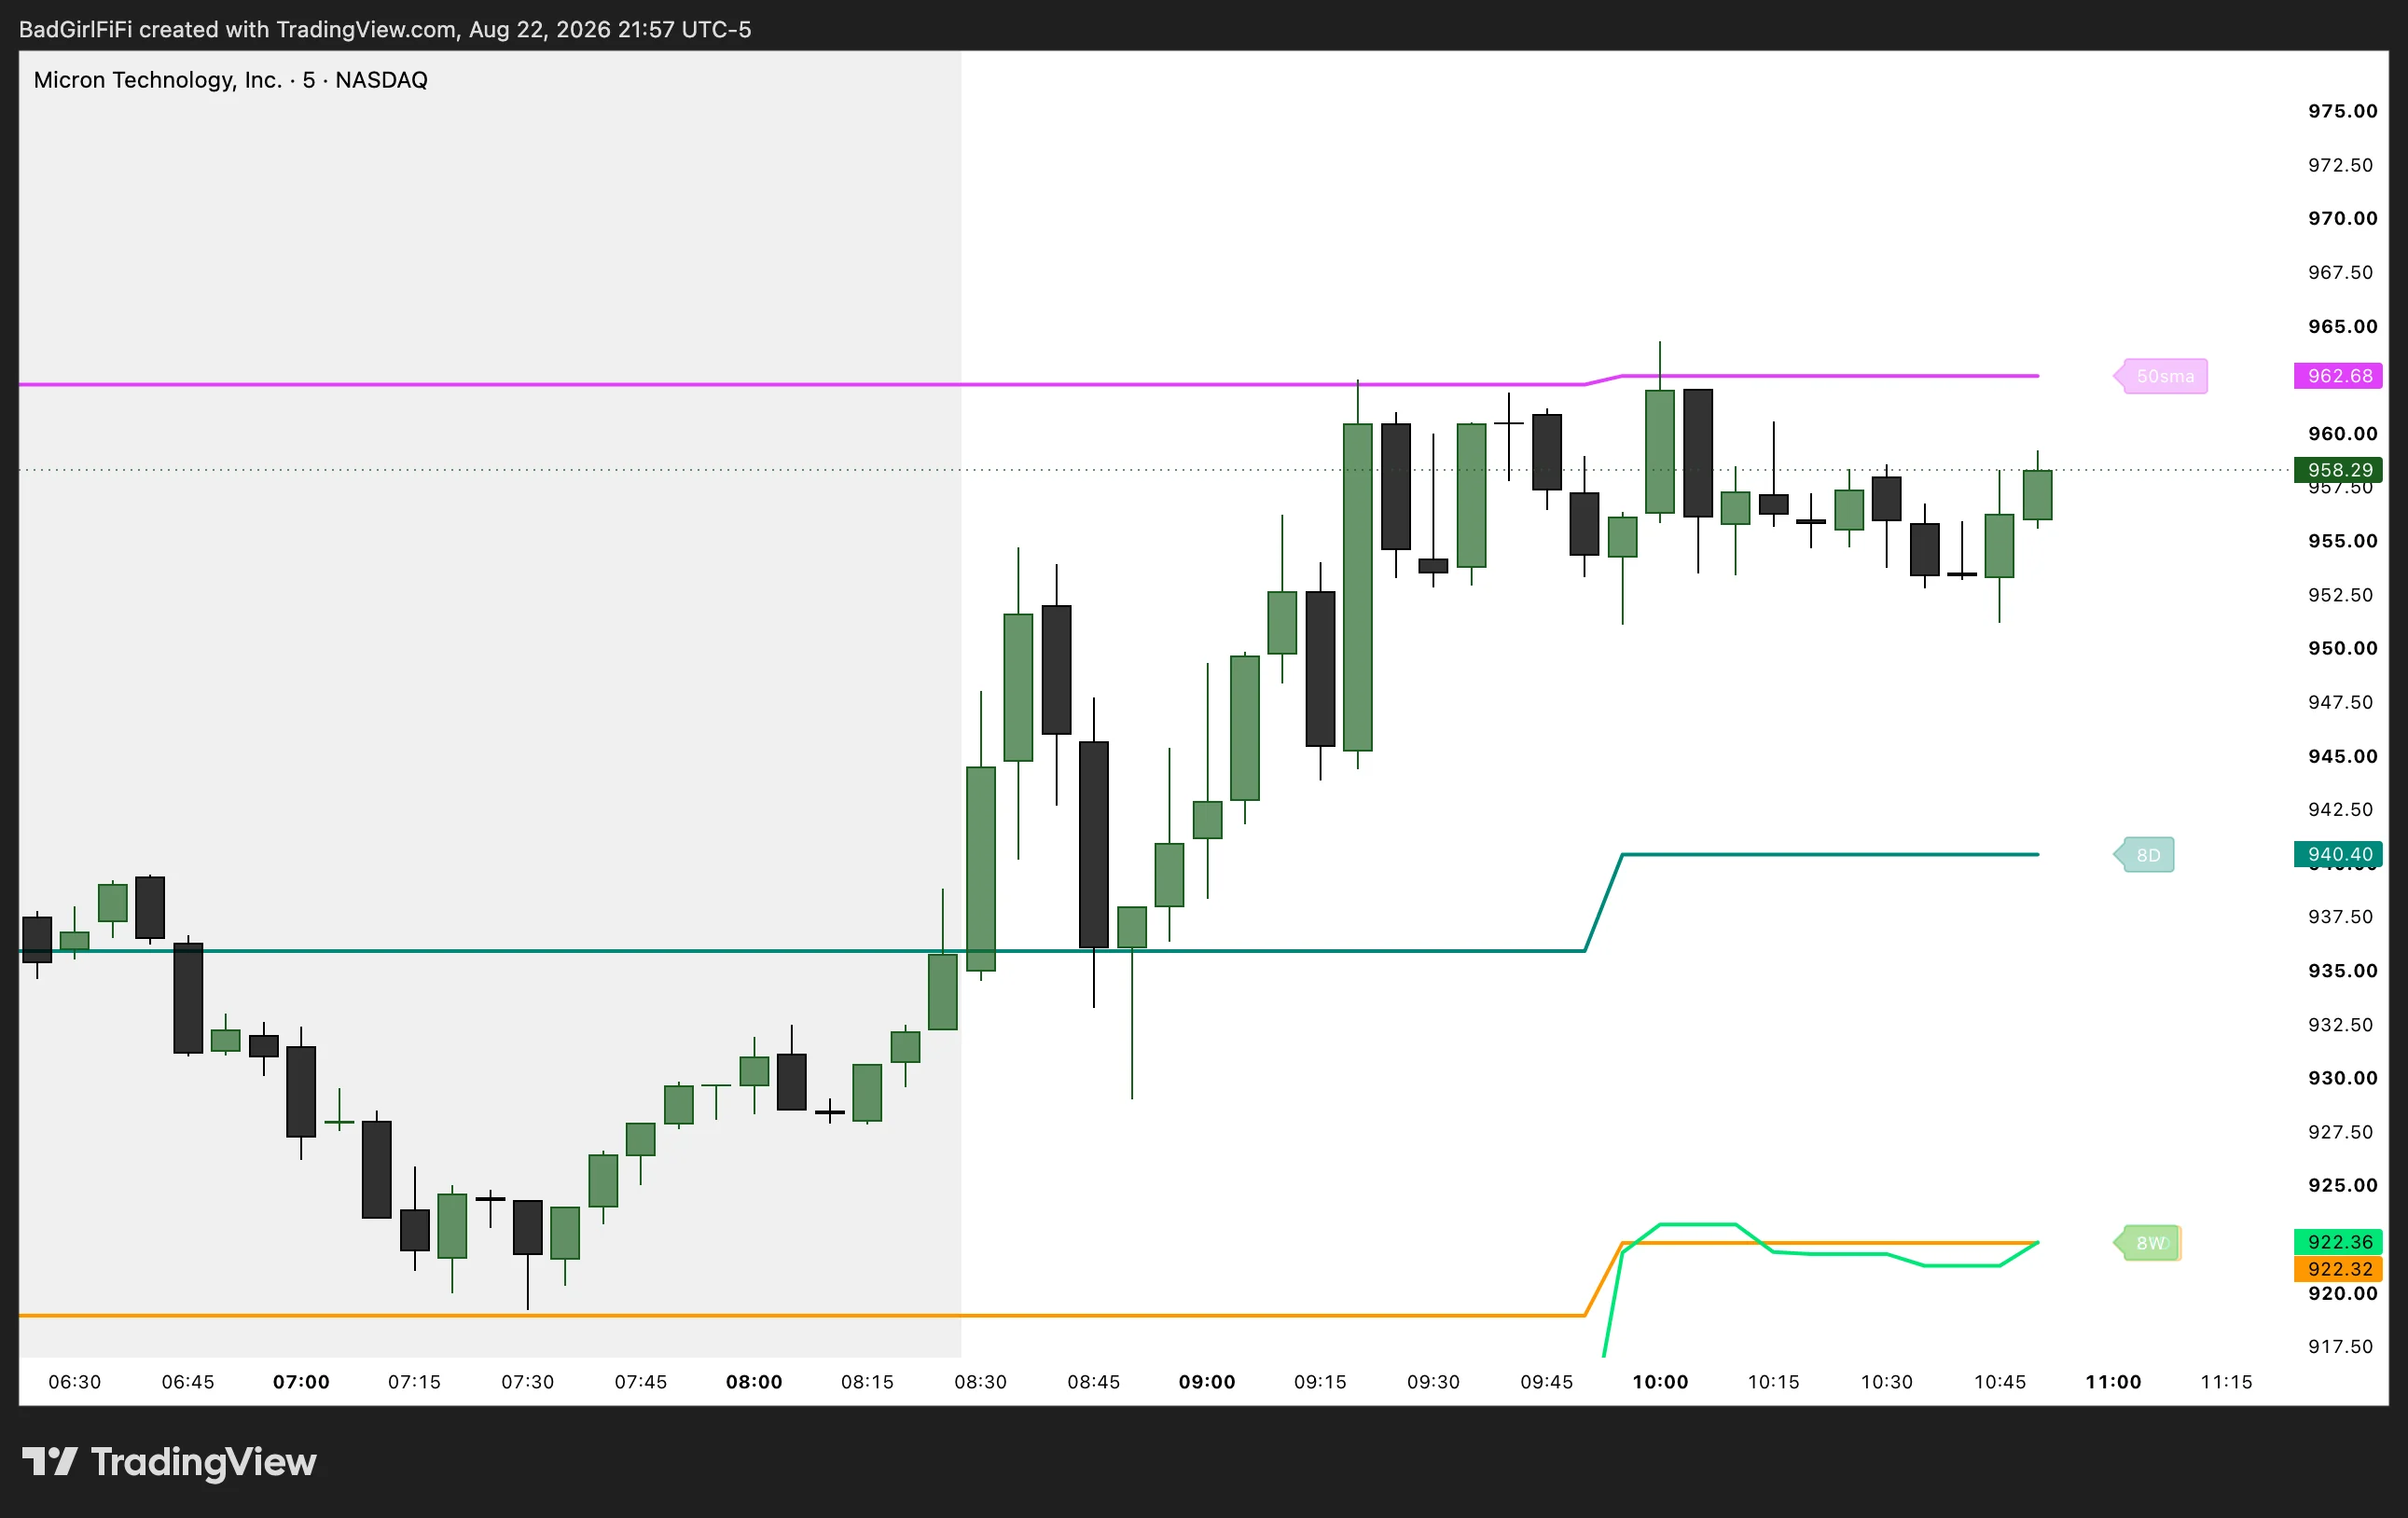 The 50 SMA at 962.68 is the only overhead reference on this chart. Price wicks through it just before 10:00 and closes back below.
Micron gapped up and ran roughly 25 points off the open — 935 to just under 964 inside the first 45 minutes. Look at the 5-minute chart alone and there’s nothing overhead to work with: no prior range in view, no pivot, no structure. Nothing to say where the move should run out of room.
The daily 50 SMA at 962.68 is the only thing marking that spot, and it’s already plotted.
Price pushed into it just before 10:00, printed a wick through, and closed back underneath. It then spent the next 45 minutes chopping between 953 and 960 without reclaiming the level. The line didn’t predict the top — it identified the zone where a vertical move was going to meet its first real seller.
Where the risk goes. The stop is a daily close above the 50 SMA — not an intraday level.
That distinction matters more than it looks. Price can wick above the line during the session, chop around it, even trade above it for an hour, without invalidating anything. What counts is where the daily bar finally settles. The level is a daily level, so the stop lives on the daily timeframe too.
The practical consequence: this is a position you’re willing to carry, not a five-minute scalp. Size it accordingly.
Note what else the chart tells you. The 8D sits at 940.40, well below price — the daily trend is intact, this is a pullback location for longs, not a trend reversal. The 21D and 8W are converged down at 922, which is where a real flush would find its next support. One glance, three timeframes.
Reading strength — NVDA, 5-minute
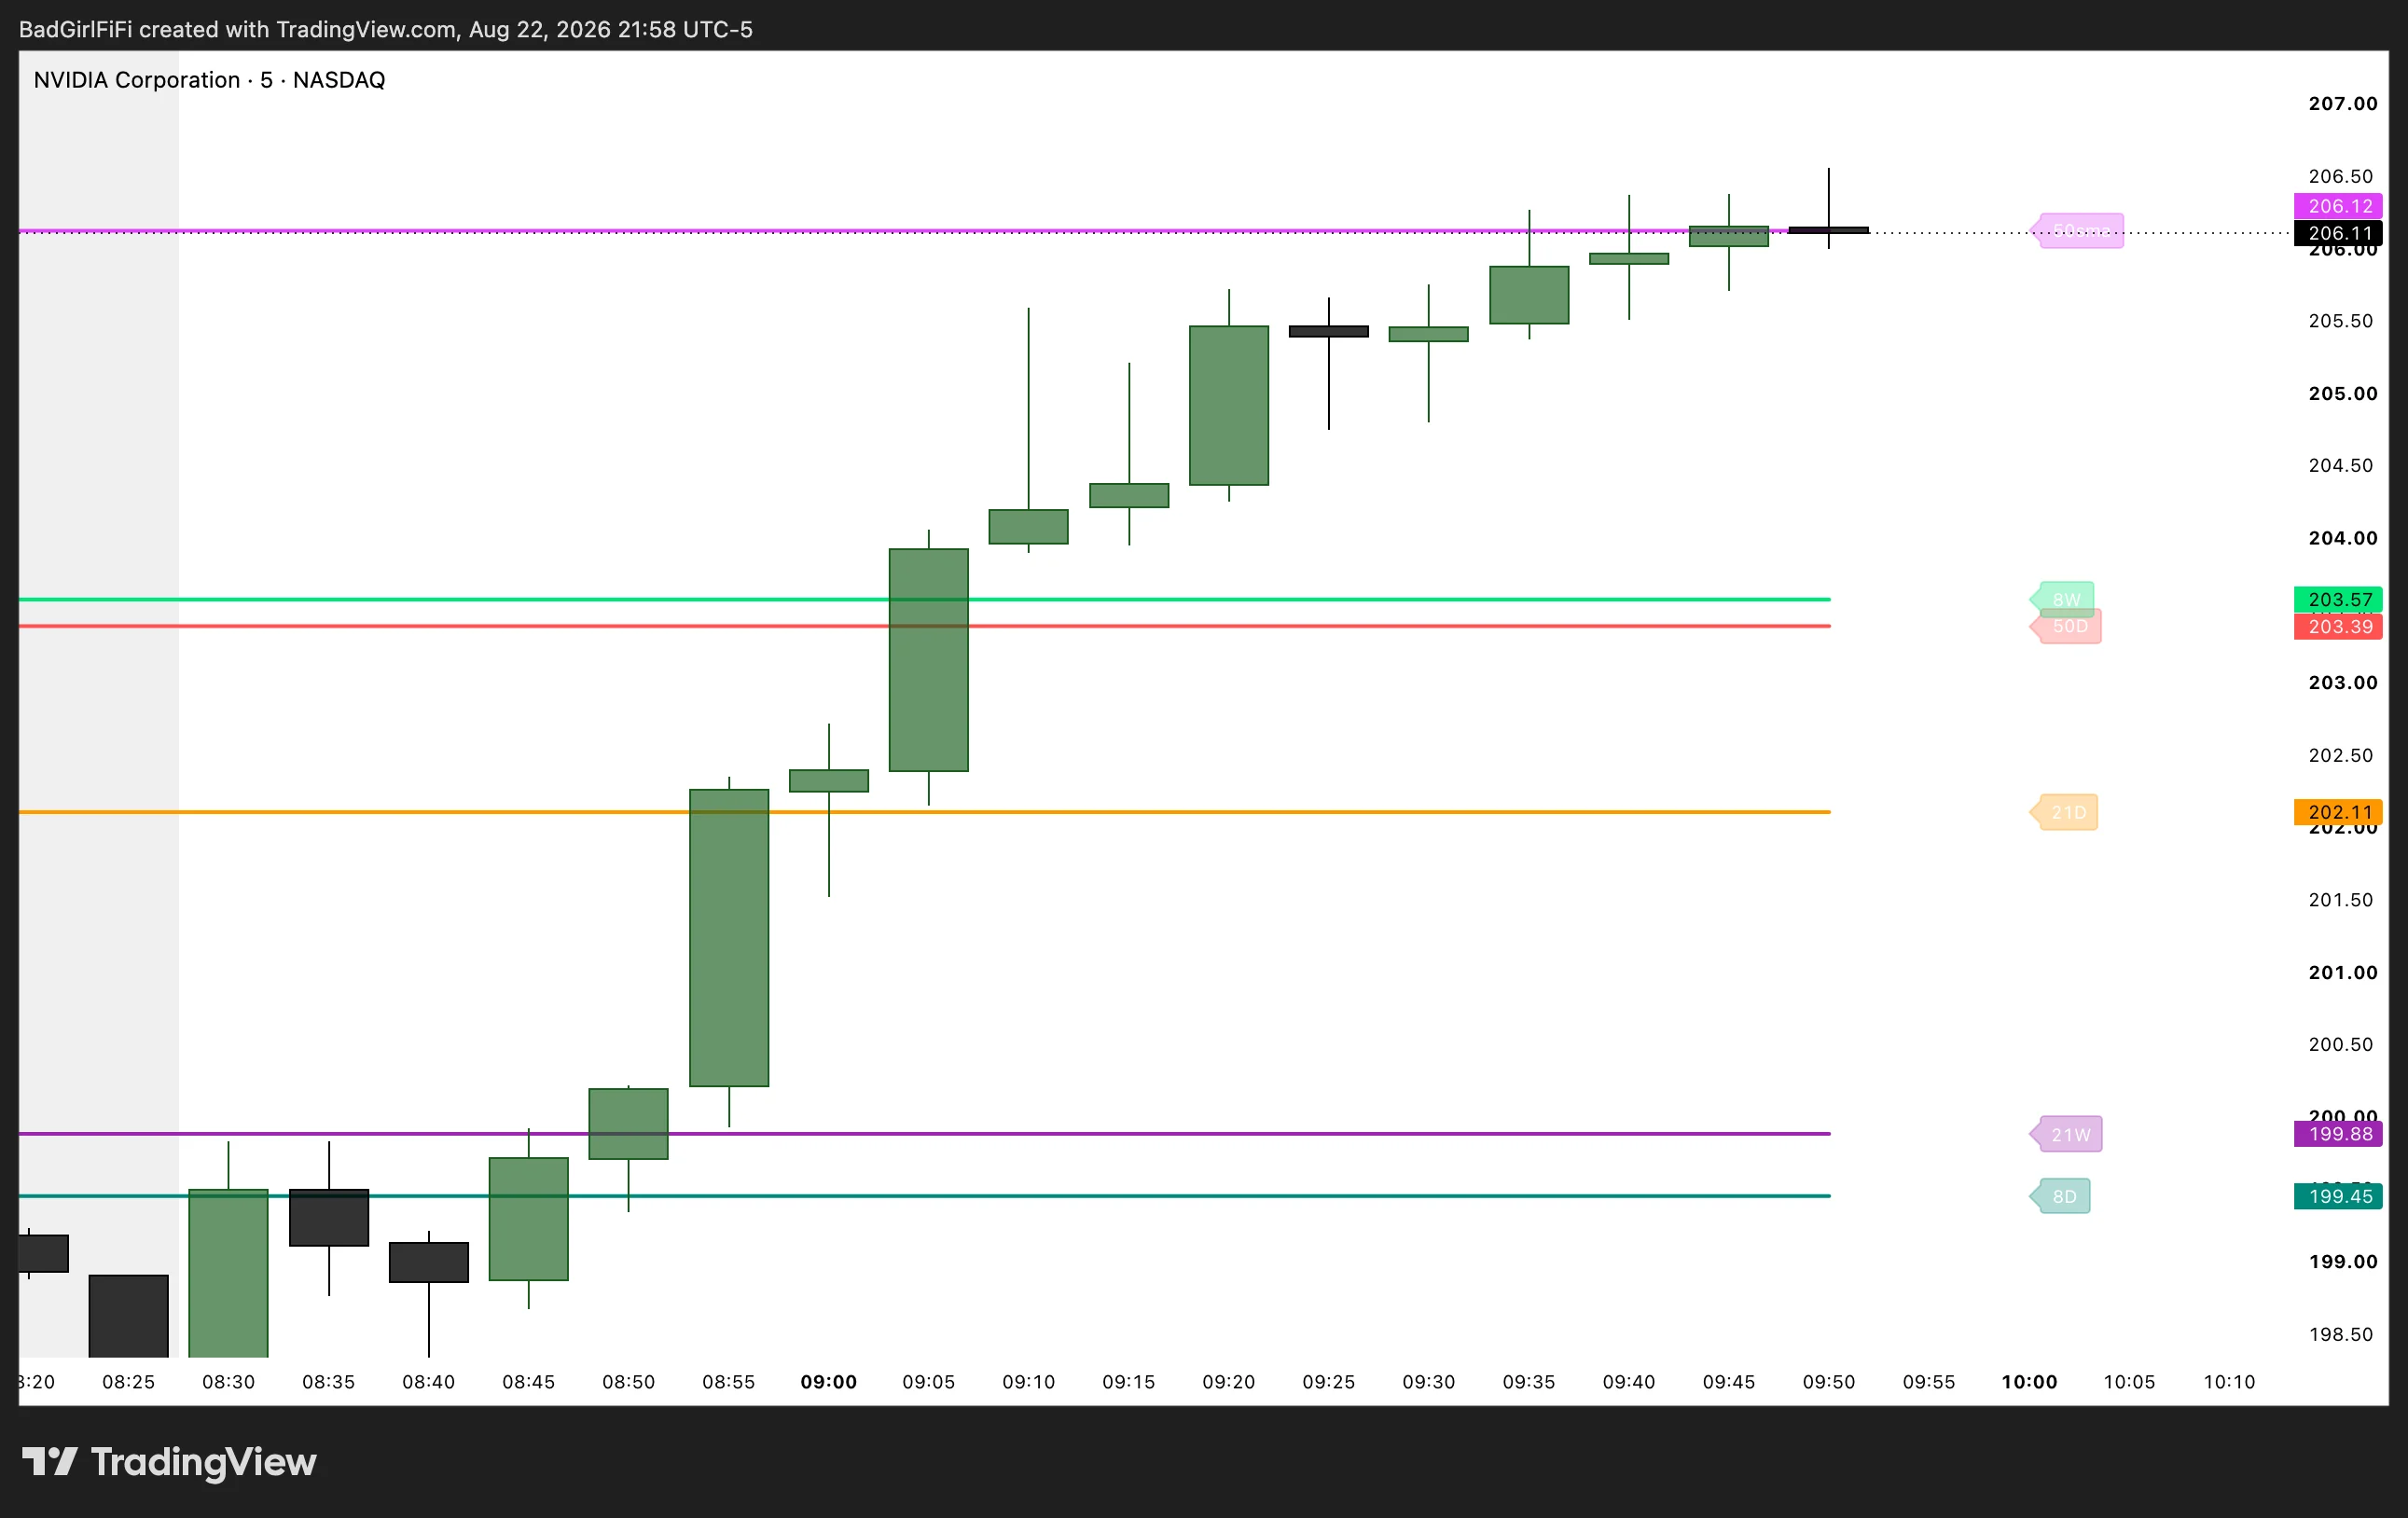 Five levels between 199.45 and 203.57. Price goes through all of them without pausing at any.
The mirror image of the MU example. NVDA opens at 198.80 with five higher-timeframe averages stacked overhead inside a five-point band:
| Level | Price |
|---|---|
| 8D | 199.45 |
| 21W | 199.88 |
| 21D | 202.11 |
| 50D | 203.39 |
| 8W | 203.57 |
By 09:05 — thirty-five minutes into the session — price is through every one of them. The 08:55 candle takes out the 21D in a single bar. The 09:05 candle clears the 50D and the 8W together, both in one move. Nothing stalls, nothing retests, nothing wicks and rejects.
That’s the signal. Any one of those levels could have capped the move. Price went through five stacked averages, on two separate timeframes, without hesitating at a single one. A stock that treats that much overhead supply as if it isn’t there is telling you something a 5-minute chart cannot: the buyers are not casual.
And it only stops at the 50 SMA at 206.12 — the last remaining level overhead, where it’s still sitting.
The contrast is the lesson. MU met the first level in its path and turned. NVDA met five and went through all of them. Same indicator, same timeframe, opposite information — and neither read is available from price action alone, because on a 5-minute chart none of those levels exist until you plot them.
How to trade it — and how not to. This is not a signal to buy at the highs. It’s first and foremost a do not short this filter. A stock cutting through that much overhead supply is not a candidate for fading, and the levels you’d normally lean against have already failed.
What the strength buys you is a reason to be long on the next pullback. The entry is a pull back into the closest EMA beneath price — not a chase after a vertical move.
The count doesn’t matter. Three levels cleared reads the same as five. It’s the manner — through them without hesitation — not the tally.
Pullback into support, then continuation — NVDA, 10-minute
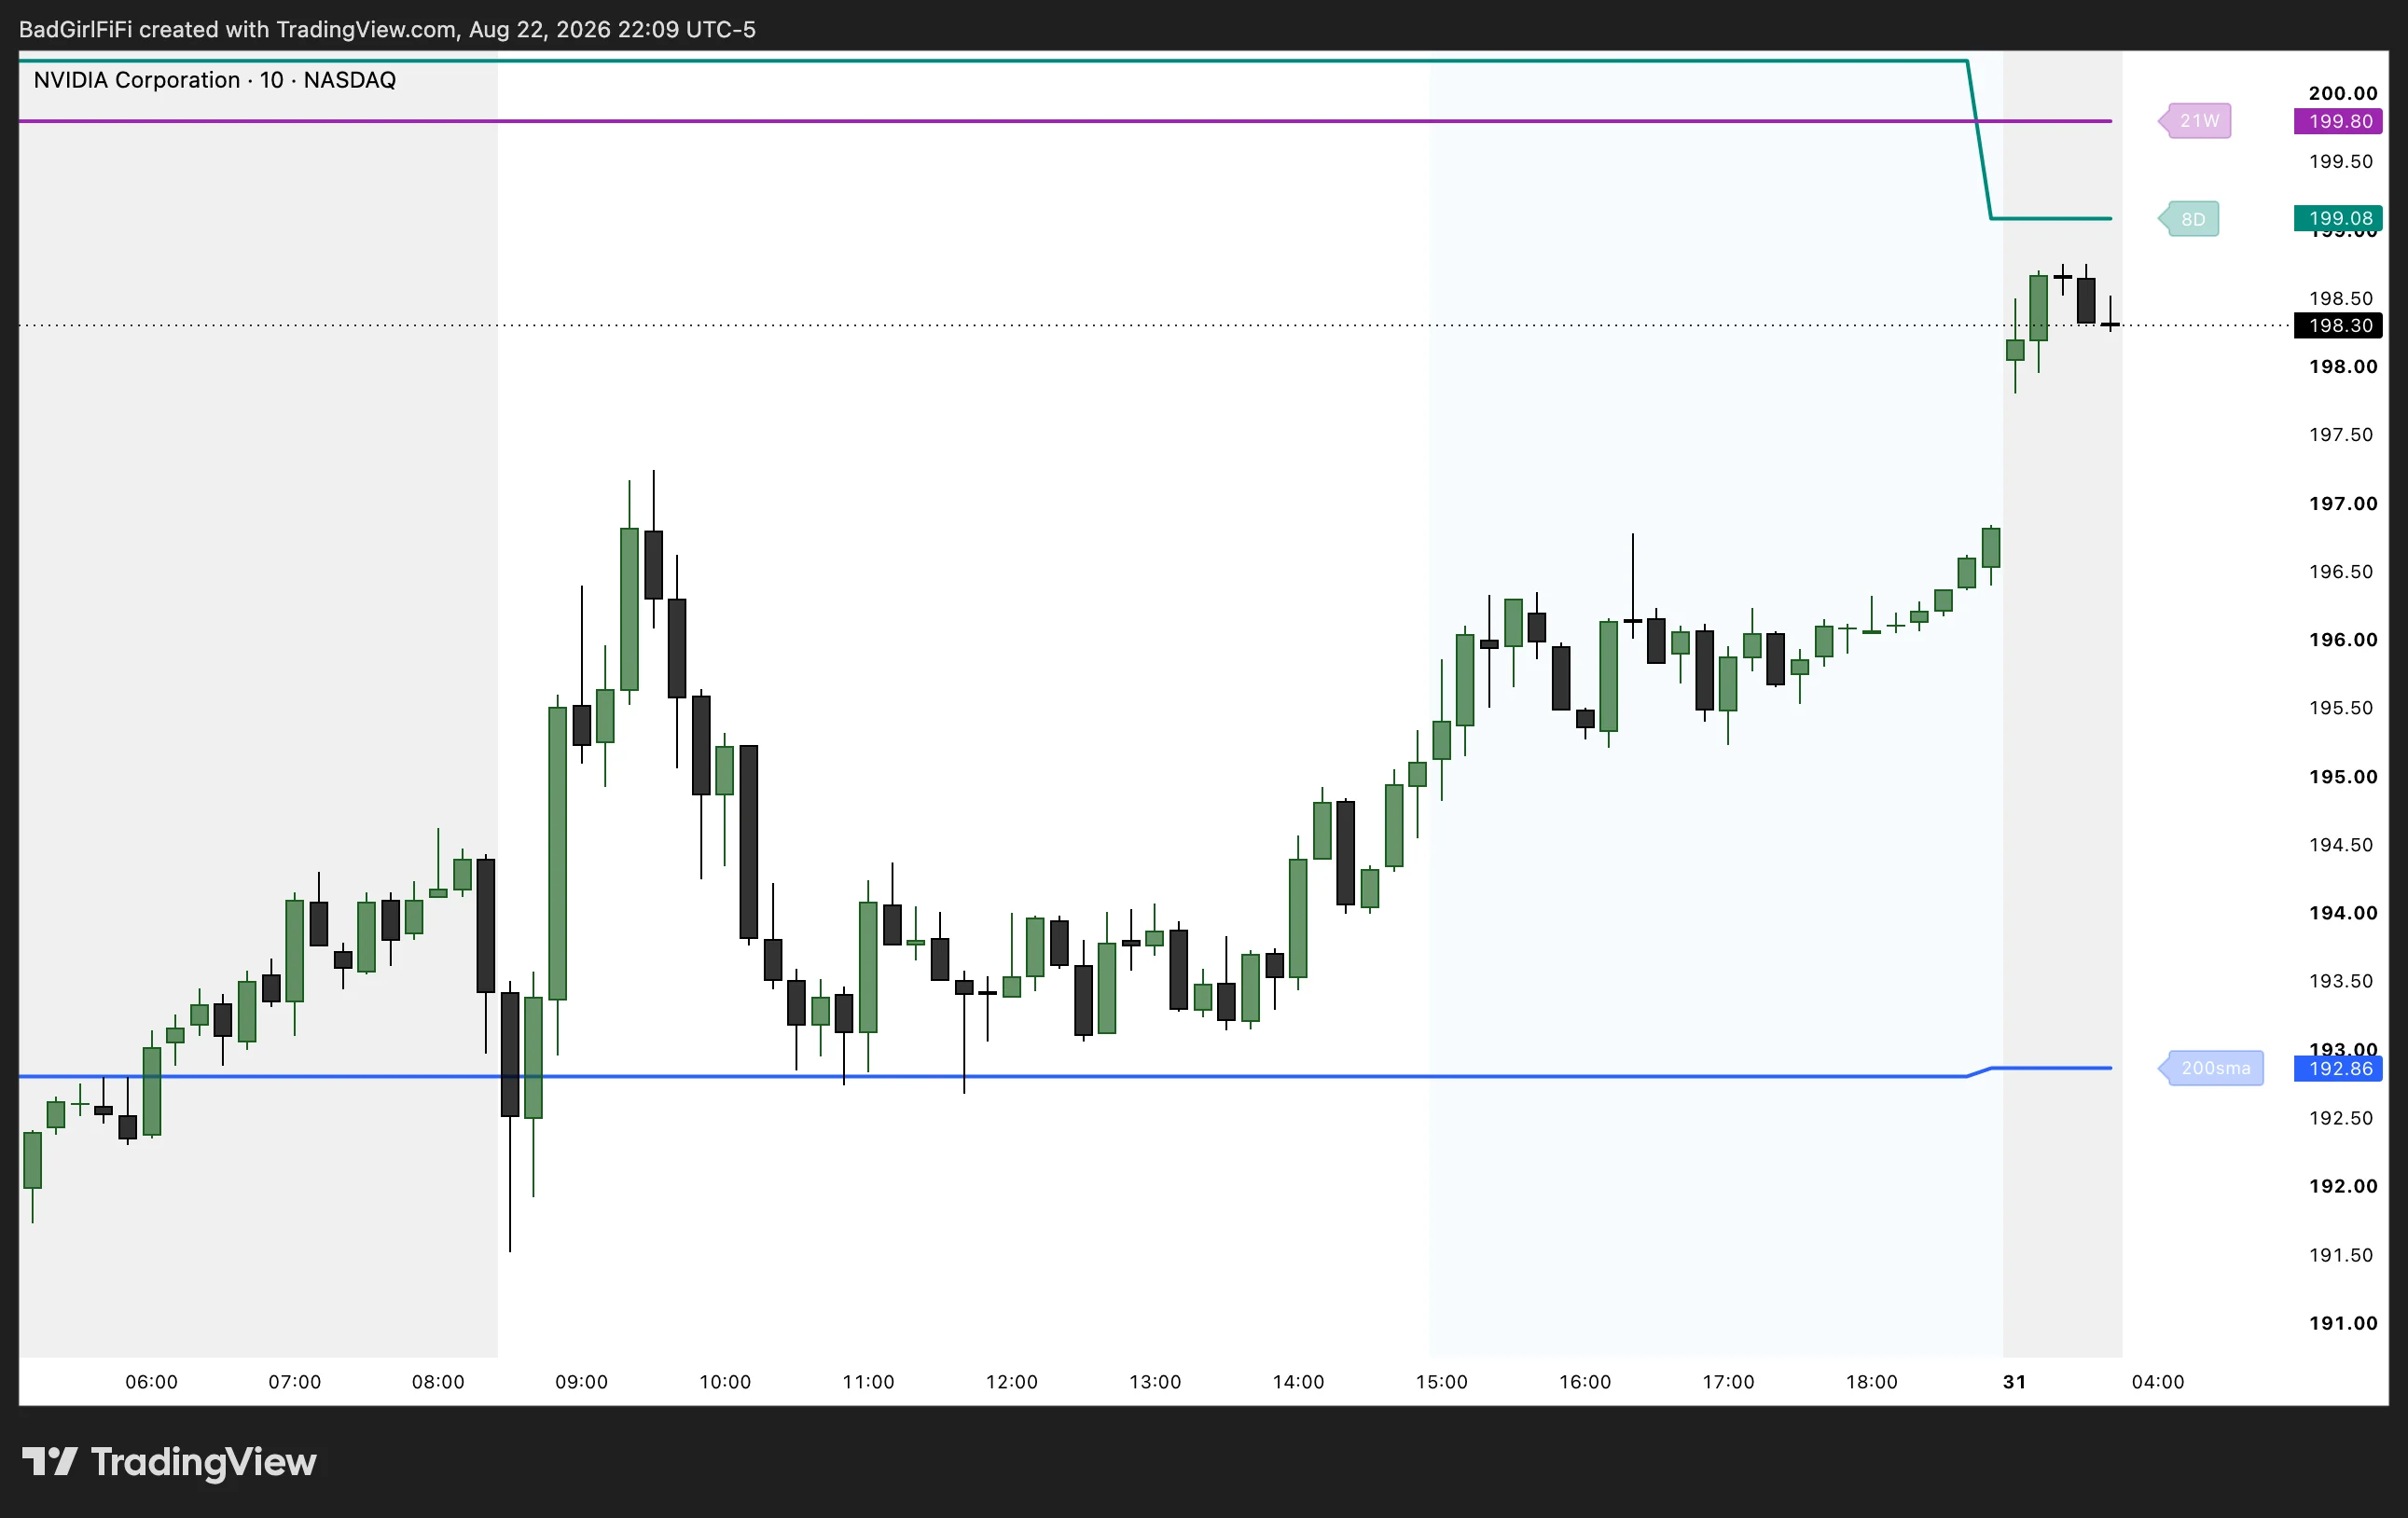 The 200 SMA at 192.86 is tested three times and holds every time. The rally that follows stops right under the 8D and 21W.
The long side of the same idea, and the cleanest demonstration of why the levels are worth having on a low timeframe.
The opening candle flushes below the 200 SMA at 192.86, wicking to 191.40 — and immediately closes back above it. That reclaim is the first tell. A level that absorbs a flush and hands price back is doing work.
Price then runs to 197 inside an hour and spends the rest of the morning giving all of it back, arriving right at the same line around 11:00. It tests it twice, wicks into it both times, and closes below it neither time. Midday it bases between 193 and 194 — directly on top of the level it just defended — and from 14:00 it rallies into the close, running to 198.30.
Now look at where the move ended. The rally stopped just under the 8D at 199.08 and the 21W at 199.80. The same indicator marked the floor the move launched from and the ceiling it ran into — six points apart, both plotted before the day started.
Why the reclaim matters more than the touch. Plenty of stocks touch a level. The information is in what happens next — a flush below that gets bought back, then repeated tests that refuse to close through, is a different message from a slow bleed straight down. The first test tells you the level is there; the second and third tell you someone is defending it.
How the higher-timeframe values behave
Worth understanding, because it affects what you see when you scroll back through history.
The indicator requests daily and weekly data with lookahead disabled, which is the correct and safe configuration — no future data ever leaks onto historical bars. What it does mean:
- Live, during a session: the daily lines move as today’s daily bar develops, settling at the daily close. The weekly lines move all week and settle at Friday’s close. This is what you want — the levels are current.
- Scrolling back through history: the lines step at each completed daily or weekly bar rather than tracing the intraday path they took live. This is why the daily EMAs look like a staircase on a 1-hour chart, and perfectly flat across a single session on a 15-minute chart — each step is one completed daily bar.
The practical consequence: a touch alert that fired in real time may not line up perfectly with a touch you can see on the historical chart. This is inherent to every multi-timeframe moving average, not specific to this indicator — but don’t build a backtest off the historical rendering of these lines.
FAQ
Can I use timeframes other than daily and weekly?
Not currently. Both custom slots offer Daily or Weekly. Can the custom slots be simple moving averages? Yes. Each slot is set to EMA or SMA independently, so you can run a 200-day SMA alongside the daily EMA structure.
I'm on the 5-minute chart and can't see my weekly lines.
They’re almost certainly off the top or bottom of the visible price range. A 15-minute chart might only span two dollars of price while the 21W sits twenty dollars above. Zoom out on the price axis — drag the scale on the right — and they’ll come into view.
Why is a line missing on my chart?
The symbol probably doesn’t have enough history. A 50-day EMA needs at least 50 daily bars, and a 21-week EMA needs roughly 21 weeks. Recently listed tickers will be missing the longer averages.
Can I add more than two custom MAs?
Two slots, by design. Seven lines on one chart is already a lot. Does this work on any symbol? Anything with daily and weekly data on TradingView.
Ready for the full engine?
This one is free. The Trade Qualification Engine is the paid suite it was built alongside.