
Overview
Every gap between Friday’s close and Monday’s open, drawn as a box, tracked until it fills, and labelled with how long it has been open.
Plenty of indicators mark gaps. The thing this one adds is the counter — a gap that closed the same session and a gap that has been sitting there for fifty-seven days are two very different pieces of information, and only one of them is worth putting on a watchlist.
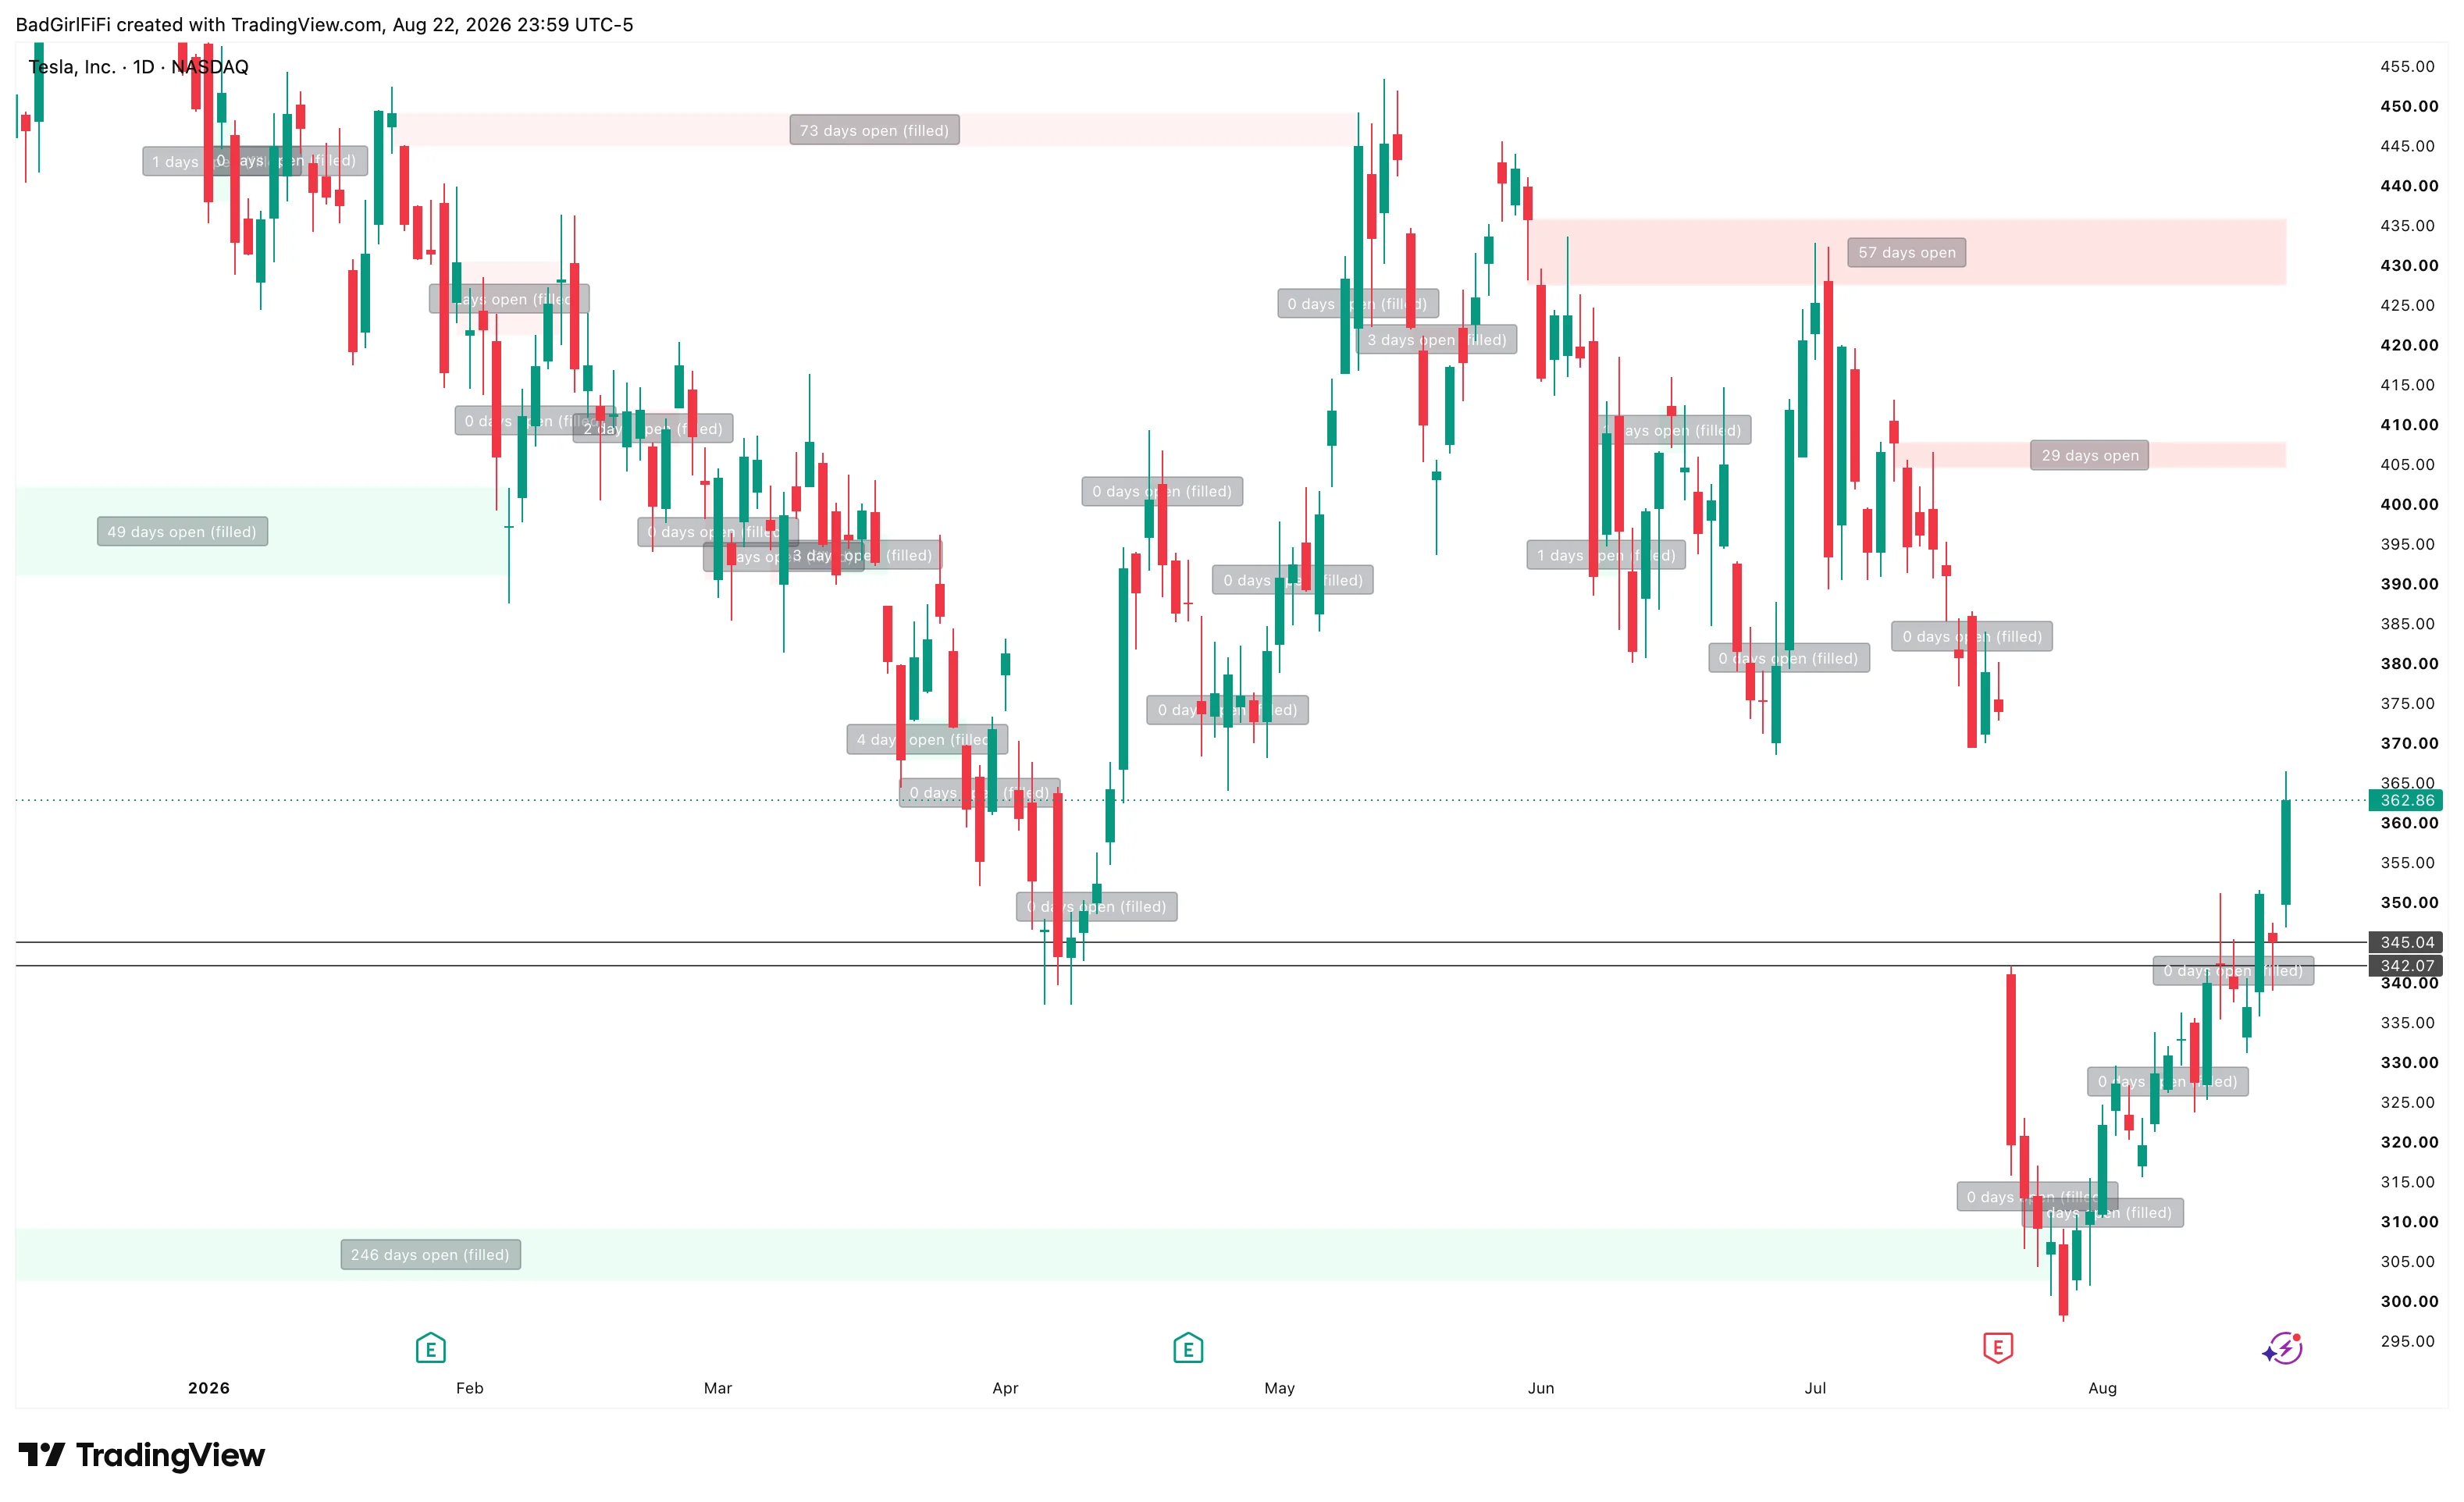 TSLA daily. Most boxes read “0 days open (filled)”. The ones reading 29, 57 and 73 days are the ones that meant something.
Look at that chart and count. The overwhelming majority of weekend gaps close the same day they form. That’s the base rate, and it’s the reason the counter matters — the exceptions are the trade, not the gaps themselves.
Daily chart only
Everything here is gated to the daily timeframe. Weekend gaps are defined by Friday’s close and Monday’s open, which only exist as a comparison between two daily bars. On any intraday chart the indicator loads and draws nothing.
If your chart is empty, that’s why.
How a gap is defined
A gap is recorded when a Monday bar opens away from the previous Friday’s close.
- Gap up — Monday opens above Friday’s close. Box drawn in green.
- Gap down — Monday opens below. Box drawn in red.
The box spans from Friday’s close to Monday’s open — the actual untraded range — and extends right until the gap fills.
The fill rule
A gap is filled when price returns to touch Friday’s closing price, the far edge of the box:
- A gap up fills when a later bar’s low reaches down to Friday’s close.
- A gap down fills when a later bar’s high reaches up to it.
Partial fills don’t count. Price dipping into the box and turning around leaves the gap open, which is the right definition — the gap isn’t closed until the untraded range has actually been traded through.
Once filled, the box fades to a paler shade and the label locks in its final count: 73 days open (filled). Filled gaps stay on the chart by default, which gives you the history of how this particular symbol treats its gaps.
Reading the counter
The label counts daily bars since the gap formed, updating while the gap stays open.
| Reading | What it tells you |
|---|---|
| 0 days open (filled) | Closed the same session. The normal outcome. |
| A few days open | Took a week or so to come back. Unremarkable. |
| Dozens of days open | Price has moved away and hasn’t returned. This is a real level. |
| Still open, high count | An unfilled target sitting above or below current price. |
A long-open gap is a magnet and a marker. It tells you where price hasn’t been willing to go back to — and if it eventually does, that’s a level worth watching for a reaction rather than a straight pass-through.
Alerts
Two systems, and you can run either or both.
Standard alerts (on by default) are named conditions — new gap up, new gap down, gap filled. Right-click → Add alert, set Condition to the indicator, then pick from the dropdown.
Dynamic price alerts (off by default) use TradingView’s alert() at bar close and carry the actual prices in the message rather than a fixed string. Turn this on and create a single alert using “Any alert() function call.”
Since the indicator runs on the daily, alerts fire once per day at the close — this is not something to watch during the session.
Settings
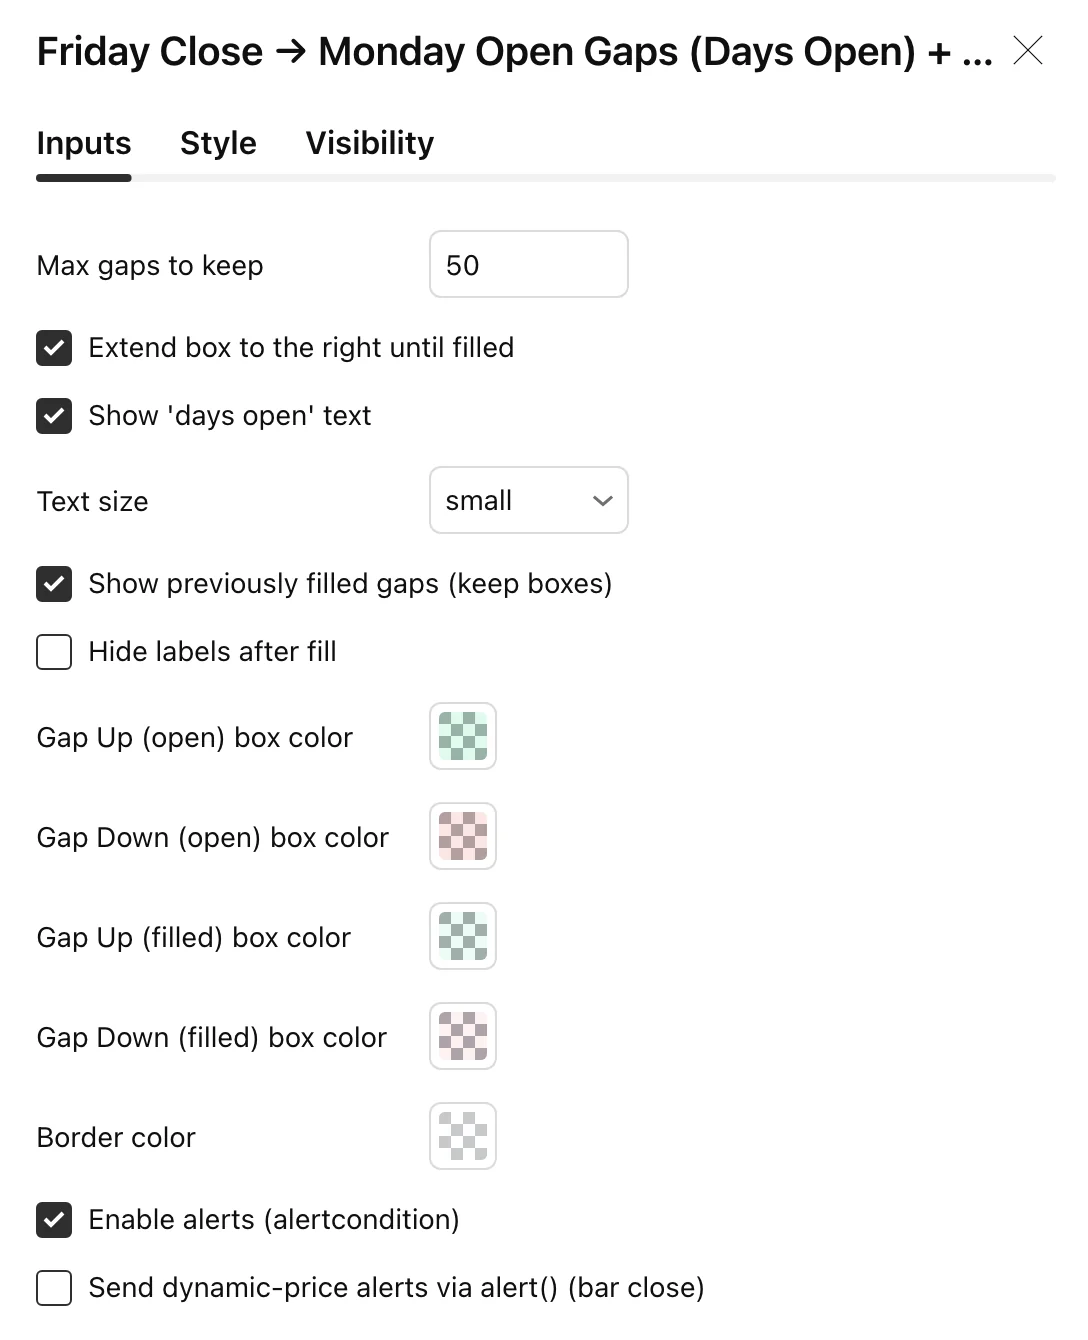
| Setting | Default | What it does |
|---|---|---|
| Max gaps to keep | 50 | How many gap boxes to retain. Older ones are dropped |
| Extend box to the right until filled | On | Open gaps stretch to the current bar |
| Show ‘days open’ text | On | The counter labels |
| Text size | small | tiny through huge |
| Show previously filled gaps | On | Keeps filled boxes on the chart as history |
| Hide labels after fill | Off | Keeps boxes but drops their labels once filled |
| Gap Up / Down (open) colour | Green / red | Unfilled gaps |
| Gap Up / Down (filled) colour | Paler green / red | Filled gaps |
| Border colour | Faint white | Box outlines |
| Enable alerts | On | The named alert conditions |
| Send dynamic-price alerts | Off | alert() messages with live prices |
On a busy chart, turn off “Show previously filled gaps.” Fifty boxes of history is useful when you’re studying a symbol’s behaviour and pure clutter when you’re trading it. Leaving only the open gaps gives you a chart with three or four boxes on it, all of which matter.
Max gaps to keep is worth lowering too if you only care about the current year — 50 weekend gaps is roughly a year of Mondays.
FAQ
Nothing is drawing on my chart.
You’re not on the daily timeframe. Weekend gaps are a comparison between two daily bars and the indicator only runs there.
A holiday Monday didn't produce a gap.
Correct, and worth knowing: the check looks specifically for a Monday bar preceded by a Friday bar. When Monday is a market holiday, the week opens on Tuesday and that weekend’s gap isn’t recorded. The same applies to a Good Friday weekend, where the prior bar is a Thursday. Several long weekends a year are missed this way.
Price entered the box but the gap still shows as open.
Filling requires price to reach Friday’s close — the far edge. A partial retrace leaves it open.
Why do most gaps say "0 days open"?
Because most weekend gaps fill immediately. That’s the point of the counter: it makes the rare ones obvious.
Does it repaint?
No. Gaps are recorded from completed daily bars, and a fill is confirmed by a bar actually reaching the level.
Can I use it on futures or crypto?
The logic is built around a Friday close and a Monday open, so it suits instruments with a real weekend break. Anything trading continuously through the weekend won’t produce meaningful gaps.
Ready for the full engine?
This one is free. The Trade Qualification Engine is the paid suite it was built alongside.