
Overview
A real-time watchlist intelligence table that compresses price, volume, trend and key levels into a single dashboard on your chart.
It answers one question:
“Which names deserve my attention right now — and why?”
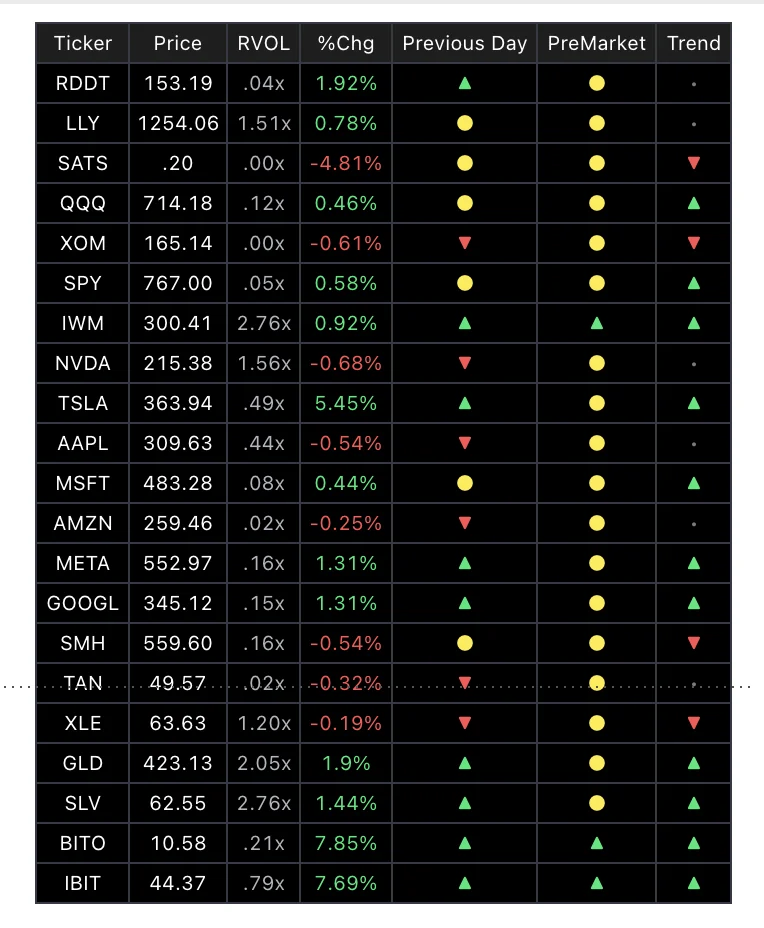 Twenty-one names, six data points each, one screen. No tab-switching, no scrolling a watchlist.
Think of it as an air-traffic control panel. It doesn’t fly the plane. It tells you which aircraft are moving and where they are relative to everything else, so you spend your chart time on the two or three that matter rather than clicking through twenty.
What it is, and what it isn’t
It is a multi-factor watchlist scanner, a context engine — price plus relative volume plus trend plus levels — and above all a time-saving filter before chart review.
It is not an auto-trader, a signal generator on its own, or a replacement for your execution rules.
The columns
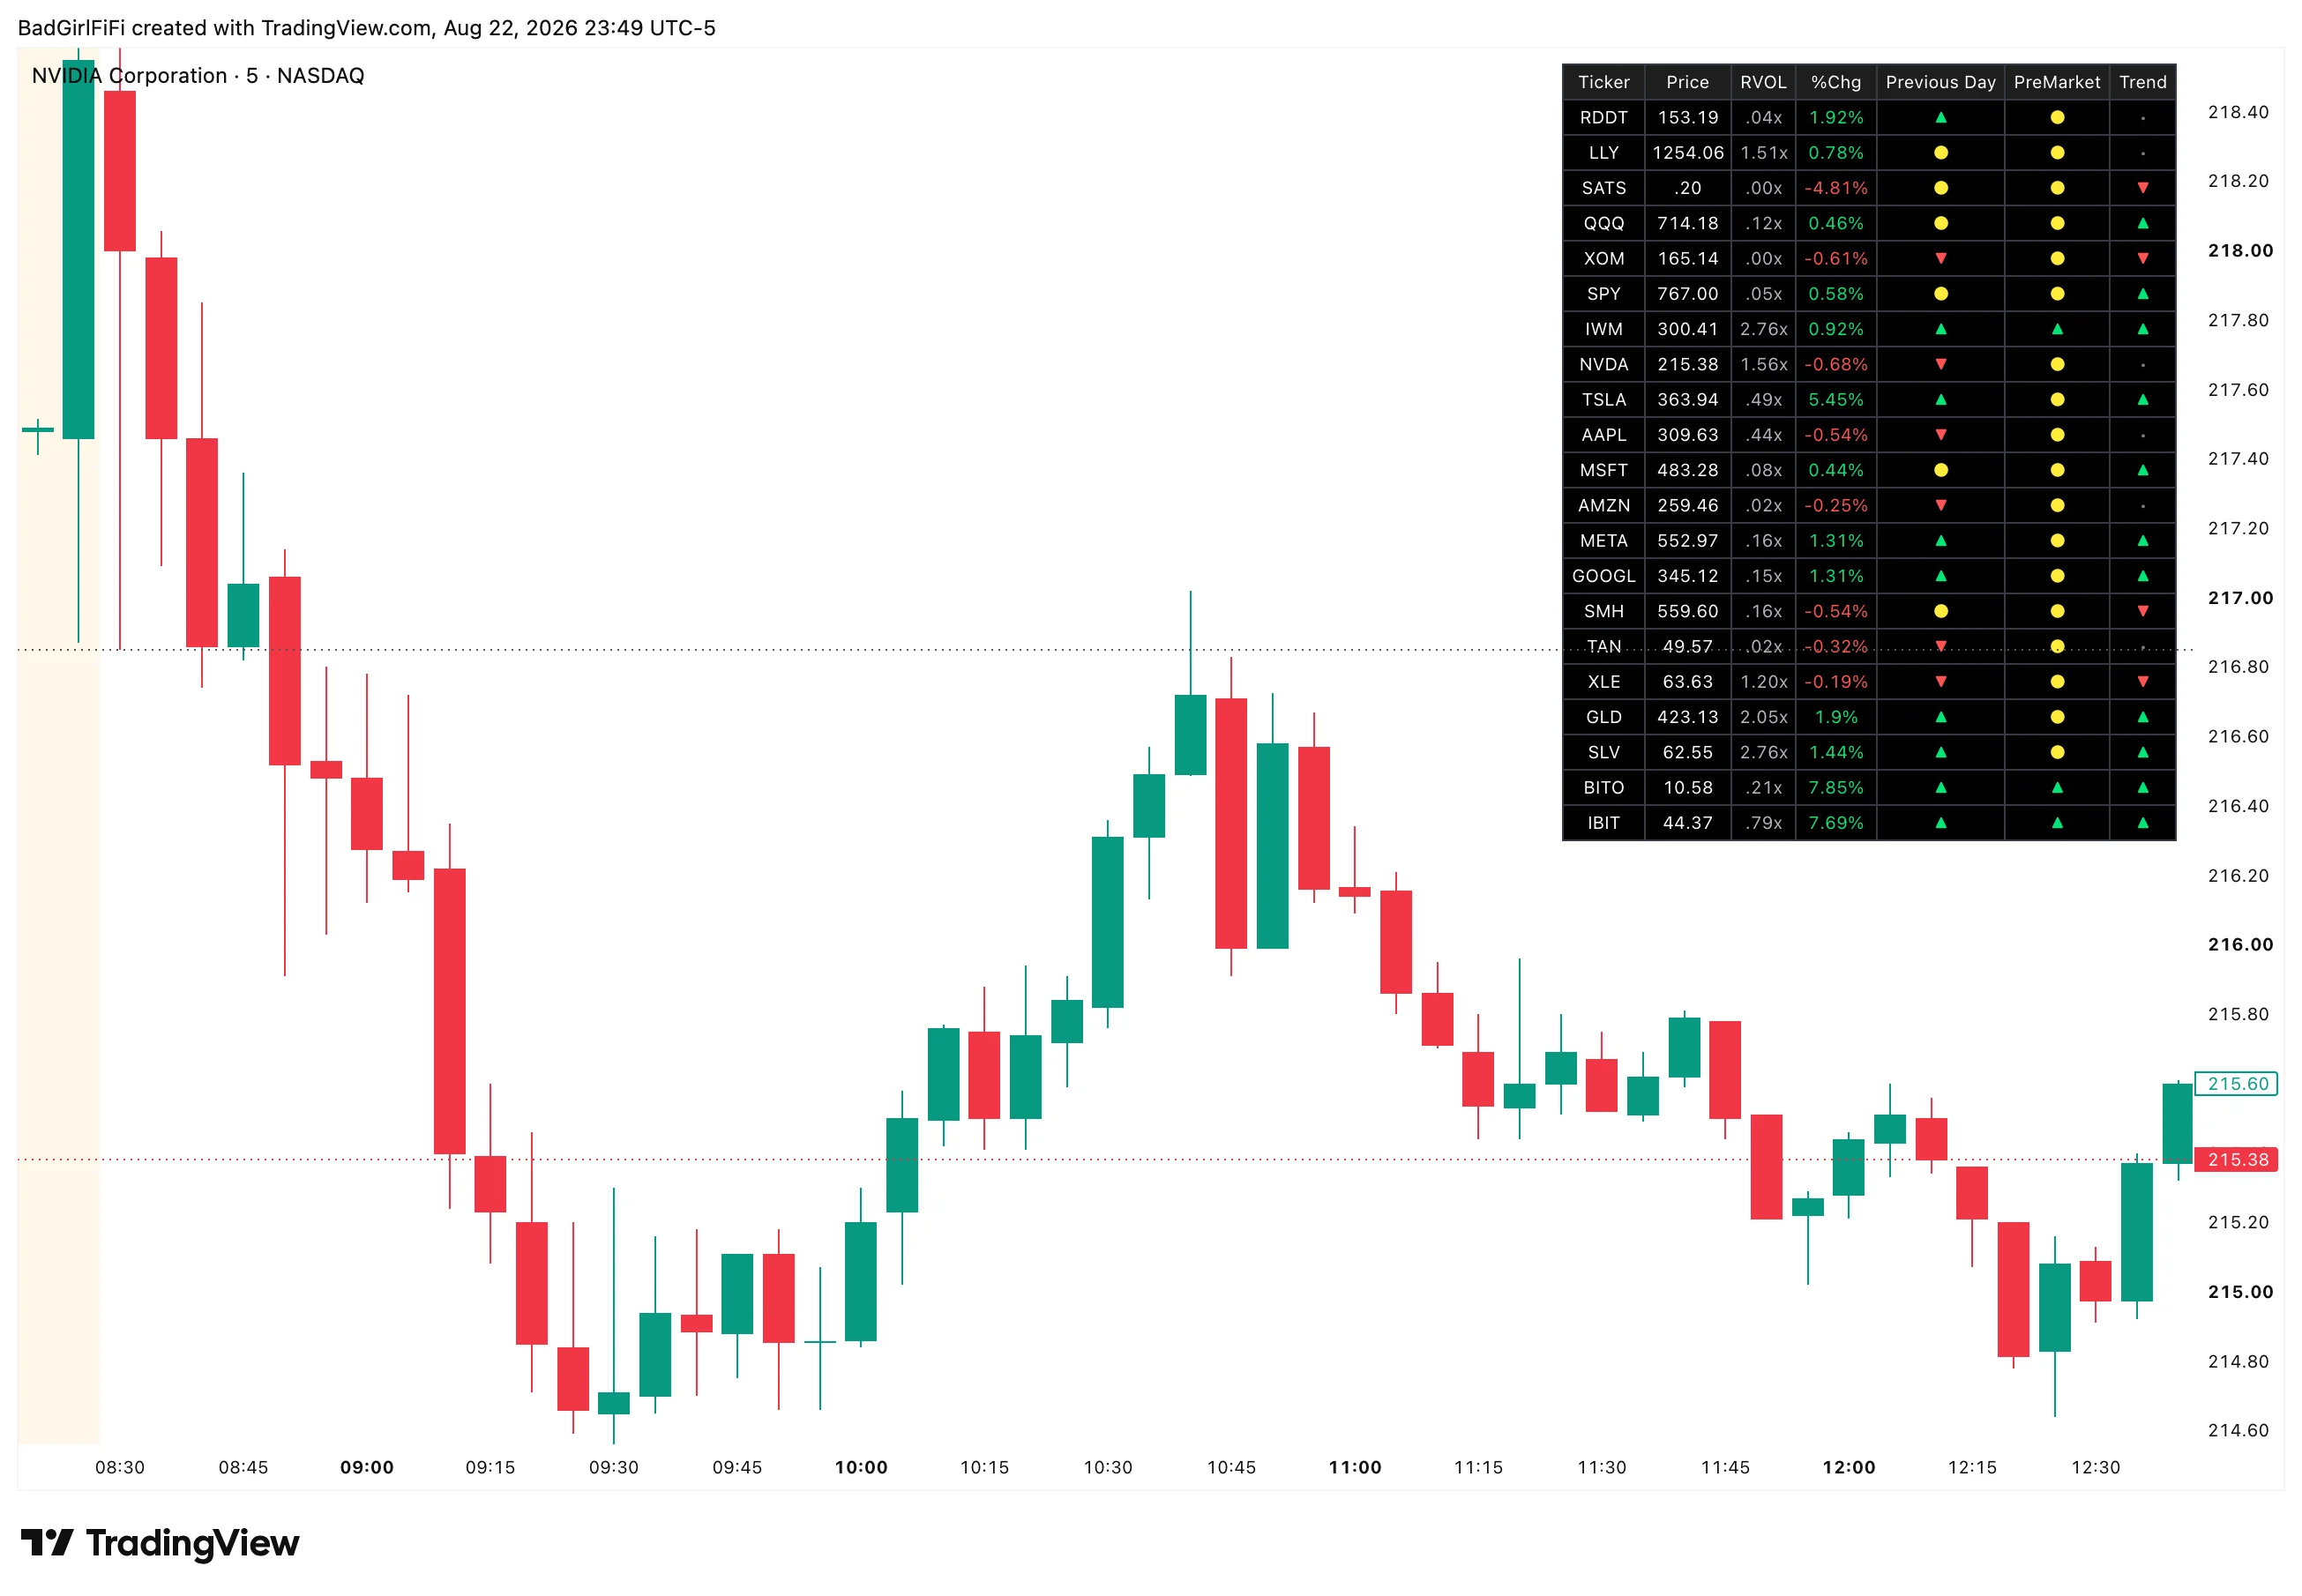
| Column | What it shows |
|---|---|
| Ticker | Clean symbol, exchange prefix stripped |
| Price | Live price — extended hours included if enabled |
| RVOL | Relative volume against a rolling average. Above 1.0x is elevated participation |
| %Chg | Change against the prior regular-hours close. Green up, red down |
| Previous Day | ▲ above prior day high · ▼ below prior day low · ● inside the range |
| PreMarket | ▲ above premarket high · ▼ below premarket low · — no premarket data |
| Trend | ▲ bullish · ▼ bearish · • neutral, from a fast-versus-slow EMA structure |
Every column can be switched off if you don’t use it. Fewer columns means a smaller table and larger text.
Trend and RVOL are measured on your chart’s timeframe, not the daily. On a 5-minute chart the Trend arrow reflects those averages of 5-minute bars — roughly two and a half sessions of structure, not the daily 50/200 most people picture. Same for RVOL: on a 5-minute chart it compares the current bar to the recent few hours, so it reads pace rather than a full-day figure. Both behave exactly as you’d want intraday; just know which question you’re asking.
The premarket lock
This is the detail that makes the PreMarket column trustworthy.
Premarket high and low are locked at the regular-session open. Once 09:30 arrives, those two levels are frozen for the rest of the day.
Without that, the levels would drift as the session went on and a “breakout above the premarket high” would keep re-defining itself — the column would repaint and mean nothing by lunchtime. Locking them at the open makes a premarket breakout an actual, durable event.
Session windows are configurable: premarket defaults to 04:00–09:30 ET and regular hours to 09:30–16:00 ET.
The quick scan method
Four steps, in order. The order is the point — it eliminates most of the list before you spend attention on it.
1 · Start with RVOL. Ignore low-participation names. A stock nobody is trading isn’t going to move for you, whatever else the row says.
2 · Check the Trend column. Align your direction with the structure that’s already there. Fighting it is the most common way to lose on an otherwise good setup.
3 · Read Previous Day and PreMarket together. Breaks mean expansion potential. Inside the range means compression — wait.
4 · Then open the chart. That’s where entries get made, with your execution tools. The scanner’s job ends when it hands you a shortlist.
Where it sits in the stack
| Tool | Question it answers |
|---|---|
| Thematic Heat Map | Where is capital flowing? |
| Multi-Level Scanner | Which tickers matter right now? |
| TQE / Trend Spine | When do I execute? |
Context → Filter → Execute. Each one narrows the field for the next.
Plan-Safe mode, and why it exists
Every enabled ticker costs about three data requests. Most TradingView plans cap at roughly forty, which puts the practical ceiling around thirteen tickers — thirteen times three is thirty-nine, just inside the line.
That’s a platform constraint, not a fault in the indicator, and it’s handled openly rather than by failing silently.
| Mode | Ceiling |
|---|---|
| Plan-Safe (default) | Thirteen tickers, adjustable |
| Premium Mode | Twenty-one tickers — needs a higher TradingView plan |
Enable more tickers than your cap allows and the scanner suppresses the extras and tells you so, with a warning row naming how many it’s showing out of how many you enabled. Nothing disappears quietly.
The two-table setup
The intended power-user configuration, and it sidesteps the limit entirely:
Add the indicator twice, with different ticker sets and Premium Mode off on both.
- Table A — active, high priority. Eight to thirteen names you might trade today. Position it top left.
- Table B — secondary, context. Eight to thirteen different names — swings, sectors, ETFs. Position it bottom right.
Both stay plan-safe, both stay readable, and you’ve separated what I might trade today from what I’m keeping an eye on — which is a better mental model than one undifferentiated list of twenty-six.
Layout
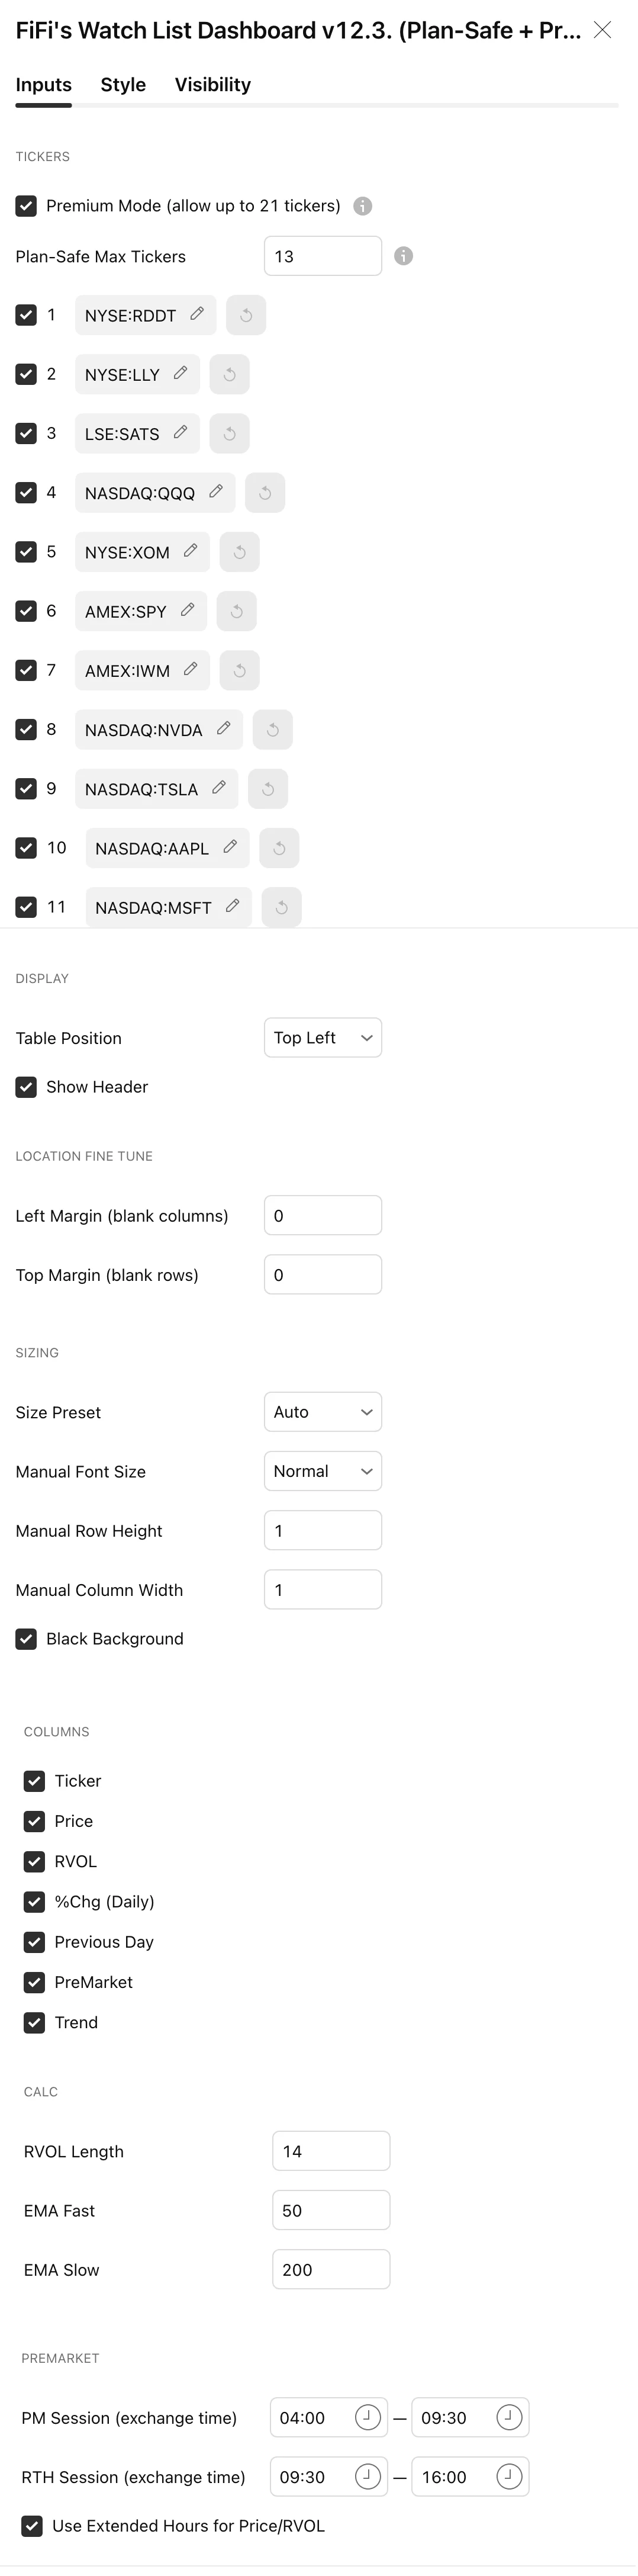
Size Preset on Auto is the recommendation. It adjusts font and spacing based on how many tickers and columns you have enabled — the table tightens as it grows so it stays inside its corner. Compact, Normal and Large override it; the manual font, row height and column width settings apply when you’re not on a preset.
| Setting | Default | What it does |
|---|---|---|
| Table Position | Top Left | Six corner options |
| Show Header | On | The column headings row |
| Left / Top Margin | 0 | Blank columns or rows, to nudge the table off the edge |
| Size Preset | Auto | Auto, Compact, Normal, Large |
| Manual Font / Row Height / Column Width | Normal, 1, 1 | Used when not on a preset |
| Black Background | On | Forced dark background — recommended for contrast |
| RVOL Length | — | Bars in the relative-volume average |
| EMA Fast / Slow | — | The pair behind the Trend column |
| PM / RTH Session | 04:00–09:30, 09:30–16:00 | Exchange time |
| Use Extended Hours for Price/RVOL | On | Include pre- and post-market data |
Left and Top Margin are worth knowing about: they insert blank cells rather than moving the anchor, which lets you slide the table clear of the price axis or a chart legend without giving up the corner.
Common mistakes
- Watching too many tickers in one table. Twenty-one rows is a wall of text, not a dashboard. Two tables of ten beat one of twenty every time.
- Ignoring RVOL. It’s the first filter for a reason. Everything else on the row is theoretical if nobody is trading the name.
- Trading against the Trend column. The arrow is there to stop you doing exactly that.
- Treating it as a signal engine. It tells you where to look. It does not tell you to buy.
FAQ
Why is RVOL showing 0.00x on some names?
Outside regular hours the current bar has almost no volume against its recent average. It’s not broken — it’s telling you nobody is trading right now.
Some rows are missing and I get a warning.
You’ve enabled more tickers than your plan cap allows. Either reduce the list, turn on Premium Mode if your TradingView plan supports it, or use the two-table setup above.
Why does the PreMarket column show a dash?
No premarket data for that symbol — common on thinly traded names and on some non-US listings.
Can I mix exchanges and asset classes?
Yes. Each slot takes any symbol TradingView carries, including non-US listings and ETFs.
Does it repaint?
The premarket levels are locked at the open specifically to prevent that. Price, RVOL and trend are live by design — they’re meant to reflect the current bar.
Which chart timeframe should I run it on?
An intraday one. The session logic and the premarket lock are built around a regular-hours session, and the Trend and RVOL columns are read from your chart’s timeframe.
Where this fits
Every indicator in the engine is documented to the same standard.