
Overview
Raw volume tells you almost nothing on its own. Two million shares by 10am and two million by 3pm are completely different days, and a share count can’t tell them apart.
This table answers the question that actually matters mid-session: is today running ahead of normal, or behind it, at this exact point in the day?
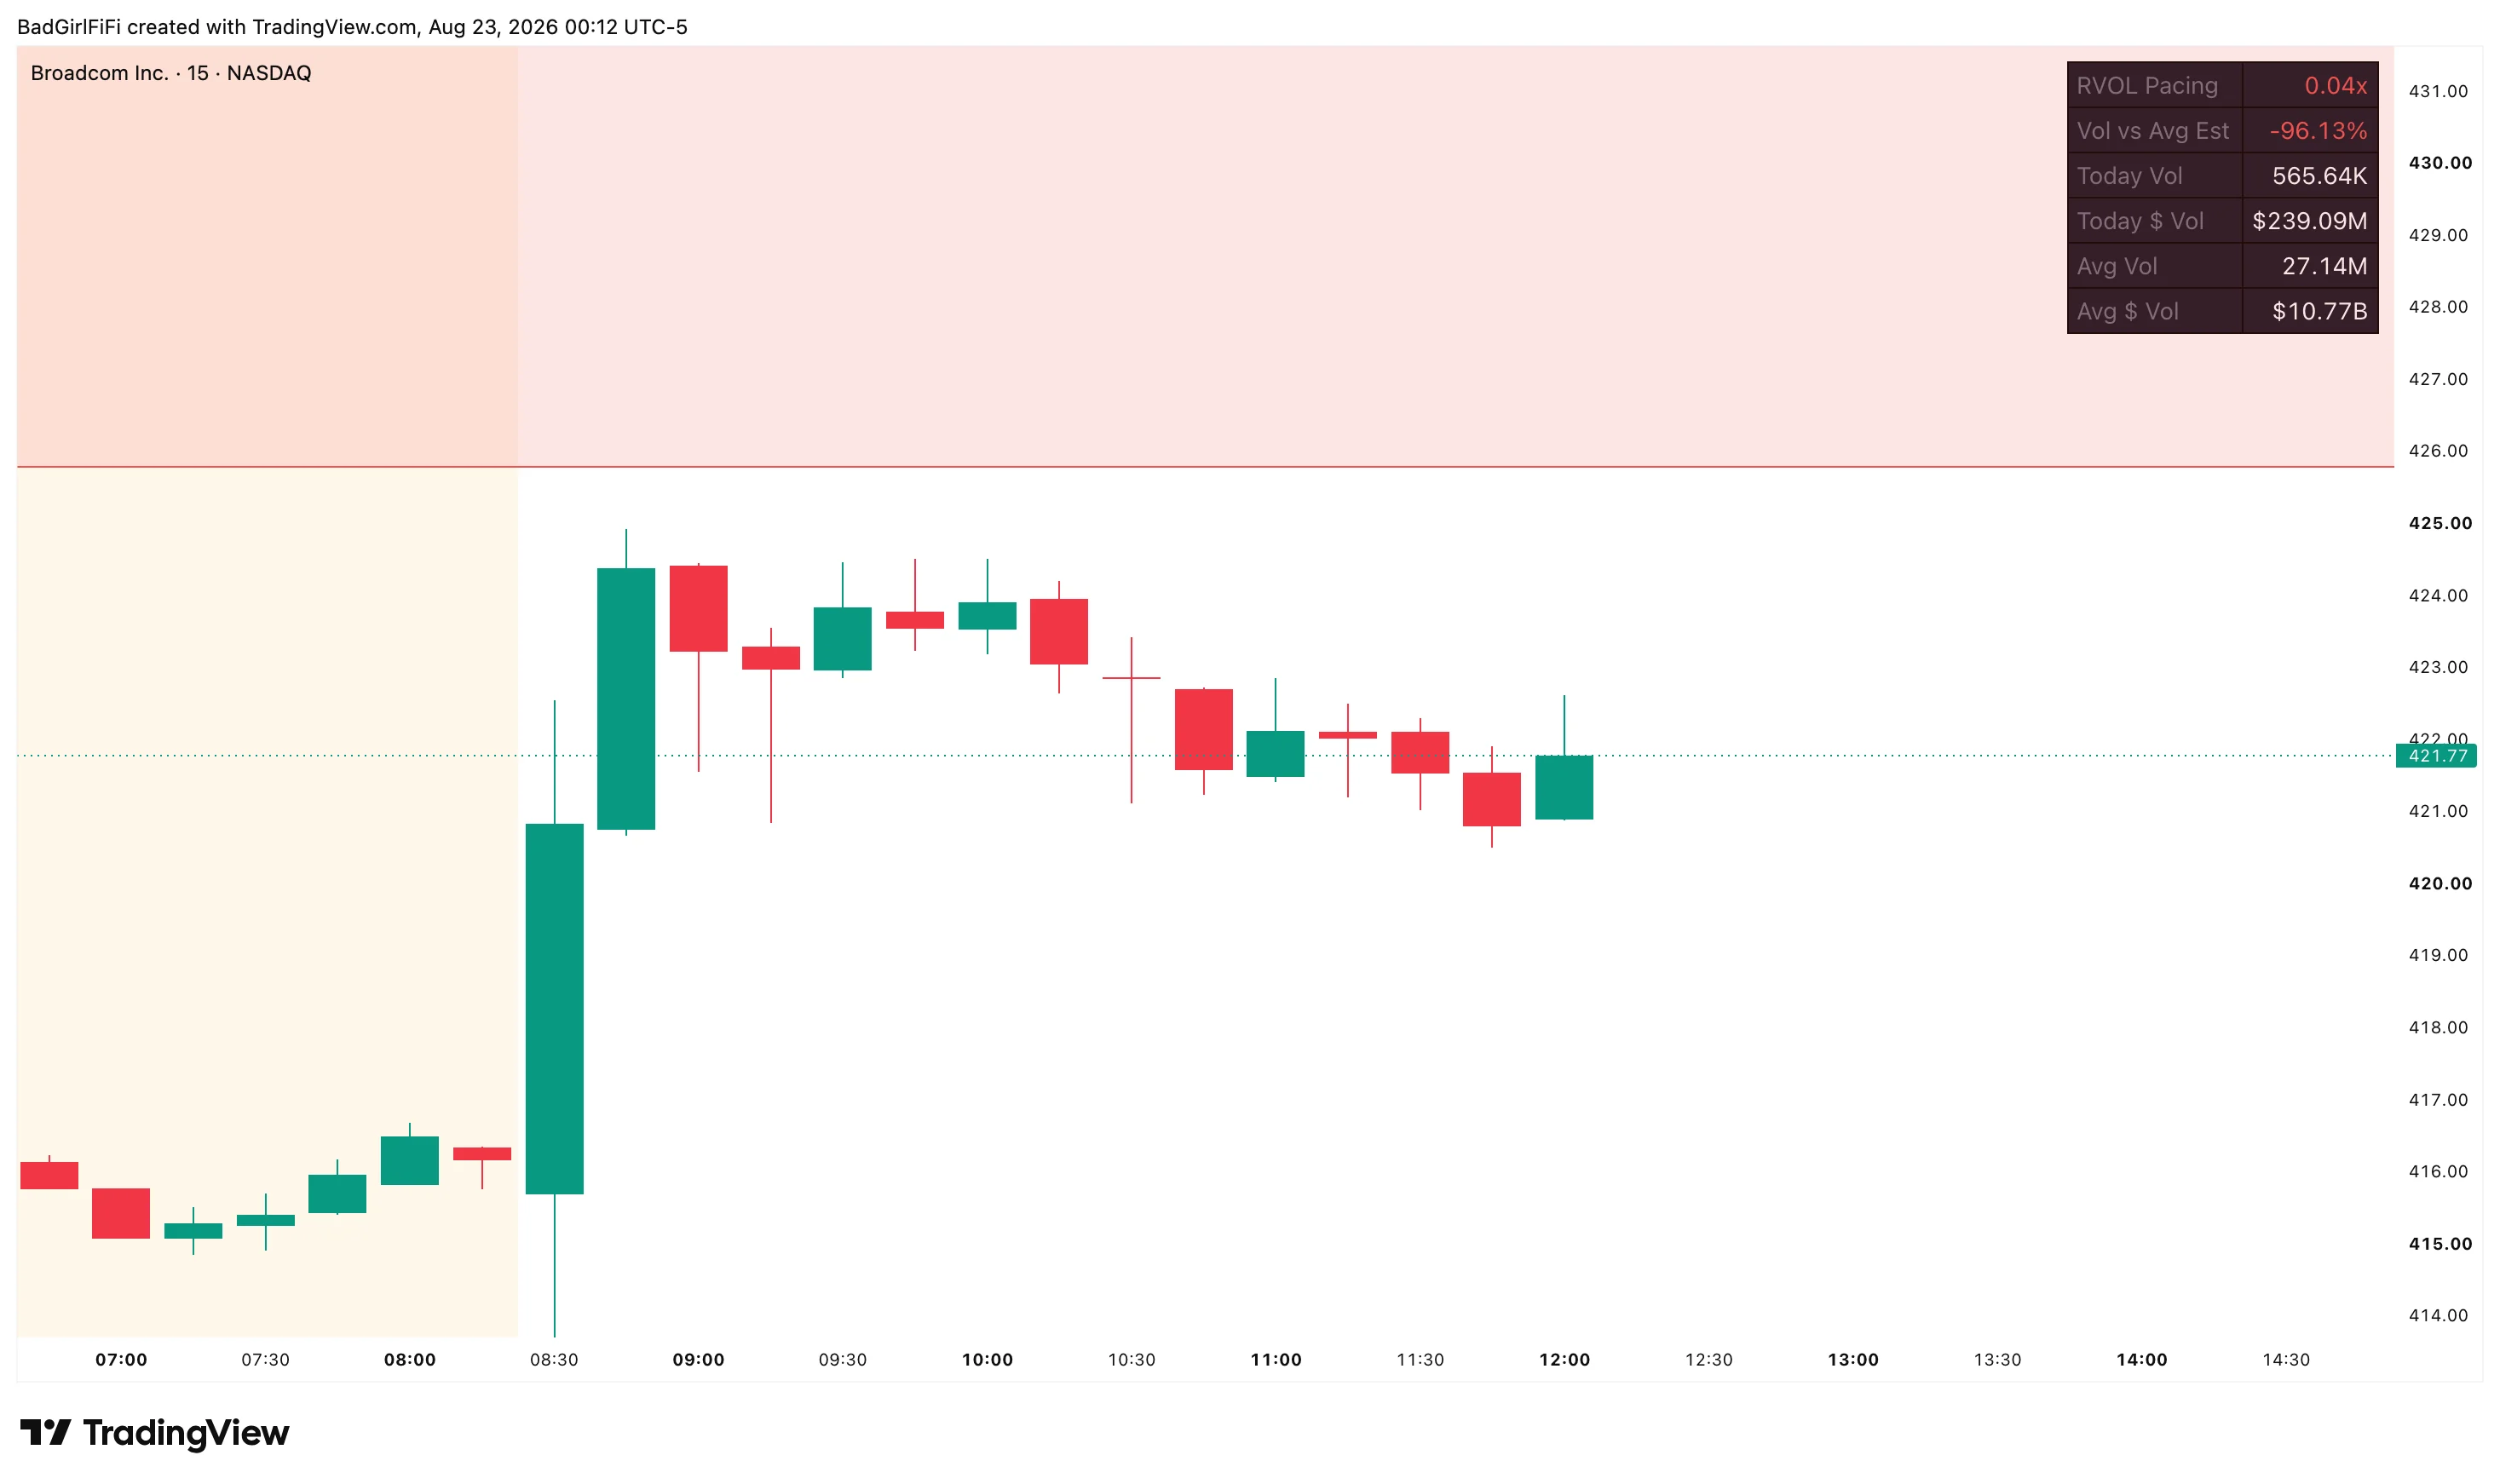 Six rows, top right. Everything you need to judge participation without leaving the chart.
How pacing works
Volume naturally clusters at the open and the close. A stock that has traded 20% of its daily average by 10:00 is doing something unusual; the same 20% by 15:30 is a dead day.
Pacing solves that by scaling the benchmark to how much of the session has actually elapsed.
At any moment the table compares today’s accumulated session volume against what this stock would normally have traded by this point. The result is a single multiple:
| Reading | Meaning |
|---|---|
| 1.0x | Exactly on pace — a completely average day so far |
| Above 1.0x | Running hot. 2x means twice the normal volume for this time of day |
| Below 1.0x | Behind. Nobody has shown up |
Vol vs Avg Est says the same thing as a percentage. −40% is running at 0.6x; +150% is running at 2.5x. Same number, whichever way you prefer to read it.
The six rows
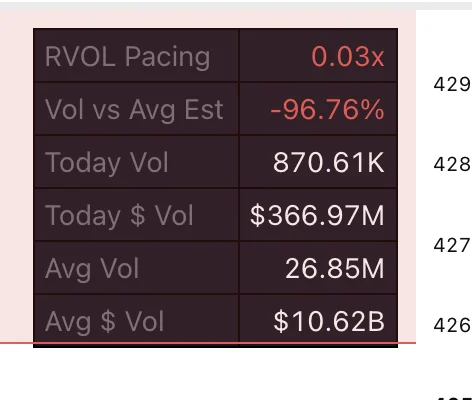
| Row | What it is |
|---|---|
| RVOL Pacing | Today’s volume against the normal pace for this time of day |
| Vol vs Avg Est | The same figure as a percentage above or below pace |
| Today Vol | Shares traded so far this session |
| Today $ Vol | Dollar volume so far — shares times price |
| Avg Vol | The average daily volume benchmark |
| Avg $ Vol | Average daily dollar volume |
The dollar rows matter more than people expect. A million shares of a $4 stock and a million shares of a $400 stock are not comparable participation. Dollar volume is what tells you whether institutions could actually operate in a name — and whether you can get in and out at size.
Any row can be switched off if you don’t use it.
Using it as confirmation
RVOL doesn’t tell you direction. It validates whatever else you’re already seeing.
A breakout on 4x pacing has real participation behind it. The same breakout on 0.8x is likely to fail or fade, because nobody showed up.
That’s the whole use case. Price action gives you the setup; pacing tells you whether anyone is behind it. Used the other way round — hunting high RVOL and looking for a reason afterwards — it doesn’t work.
It keeps you out of low-participation traps. Moves that look clean on the chart but have no volume conviction are exactly the ones that whipsaw or fail to follow through. A breakout you’re excited about, sitting at 0.3x pacing, is a breakout with nothing under it.
Reading it early in the session
The most useful window is the first fifteen to thirty minutes, and the trick is knowing what you’re comparing against before the bell.
Check what the stock did yesterday — if it traded roughly its average, then that’s your reference. Then watch the pacing as the session opens:
- The first minute or two always reads near zero. Ignore it.
- 20–30% of the daily average inside the first 15–25 minutes is genuinely notable. At that rate the name is on track for a well-above-average day.
- Still crawling after 30 minutes — no amount of chart pattern is going to rescue it.
After the first thirty minutes, pacing matters much less for entries. By the time a stock has cleared its 30-minute range on volume you already knew about, the good entry has usually gone.
Institutions hide a lot, but they leave one footprint they can’t avoid: volume. That’s all this table is reading.
Settings
| Setting | Default | What it does |
|---|---|---|
| Average Daily Volume Length | 50 | Days in the average-volume benchmark |
| Regular Session | 0930-1600 | The session used for accumulation and as the pacing baseline, read in the symbol’s exchange timezone |
| Avg $ Vol Method | Avg of Daily Dollar Volume | Or “Avg Vol × Current Price” |
| Table Position | Top Right | Eight positions |
| Table Size | Medium | Tiny through Huge |
| Row visibility | All on | Switch off any of the six rows |
| Show debug row | Off | Diagnostic — see below |
The two dollar-volume methods differ more than they look. Avg of Daily Dollar Volume averages each day’s actual dollar volume, so it reflects what the stock genuinely traded at the prices it traded at. Avg Vol × Current Price restates historical share volume at today’s price — useful if a stock has moved a long way and you want the benchmark in today’s money.
If the numbers look wrong, turn on the debug row. It prints the parsed session start and end, the current clock time in the exchange’s timezone, the elapsed fraction it’s using, and whether it thinks you’re in session. That’s almost always enough to spot a session-string or timezone problem. Turn it off once you’ve confirmed.
FAQ
Why does it read near zero right after the open?
Because almost no time has elapsed. The first minute or two is always noise — give it five minutes before reading anything into it.
Why is the pacing extremely low outside market hours?
Accumulation runs on the regular session. Outside it there’s little or no volume to compare, so the reading collapses. It isn’t broken.
Which timeframe should I use?
Any. The table reads the session’s accumulated volume, not your chart’s bars, so it shows the same figures on a 1-minute chart as on a daily.
Does it work for pre-market?
The pacing baseline is the regular session, so pre-market activity isn’t what it’s built to measure.
Should I trade off RVOL alone?
No. It’s a confirmation tool — it tells you whether participation supports what you’re seeing, not what to do about it.
Why doesn't my reading match my broker's RVOL?
Most platforms use a plain full-day comparison. This one scales the benchmark by how much of the session has elapsed, which is why it’s usable mid-session and a full-day figure isn’t.
Ready for the full engine?
This one is free. The Trade Qualification Engine is the paid suite it was built alongside.