
Overview
Nine reference levels, plotted automatically, labelled with their prices, and redrawn every day without you touching anything.
These are the levels intraday traders draw by hand every morning — yesterday’s high and low, the weekly range, today’s open, VWAP, the daily 21 EMA. Drawing them takes five minutes a day and you’ll still miss one on the day it matters.
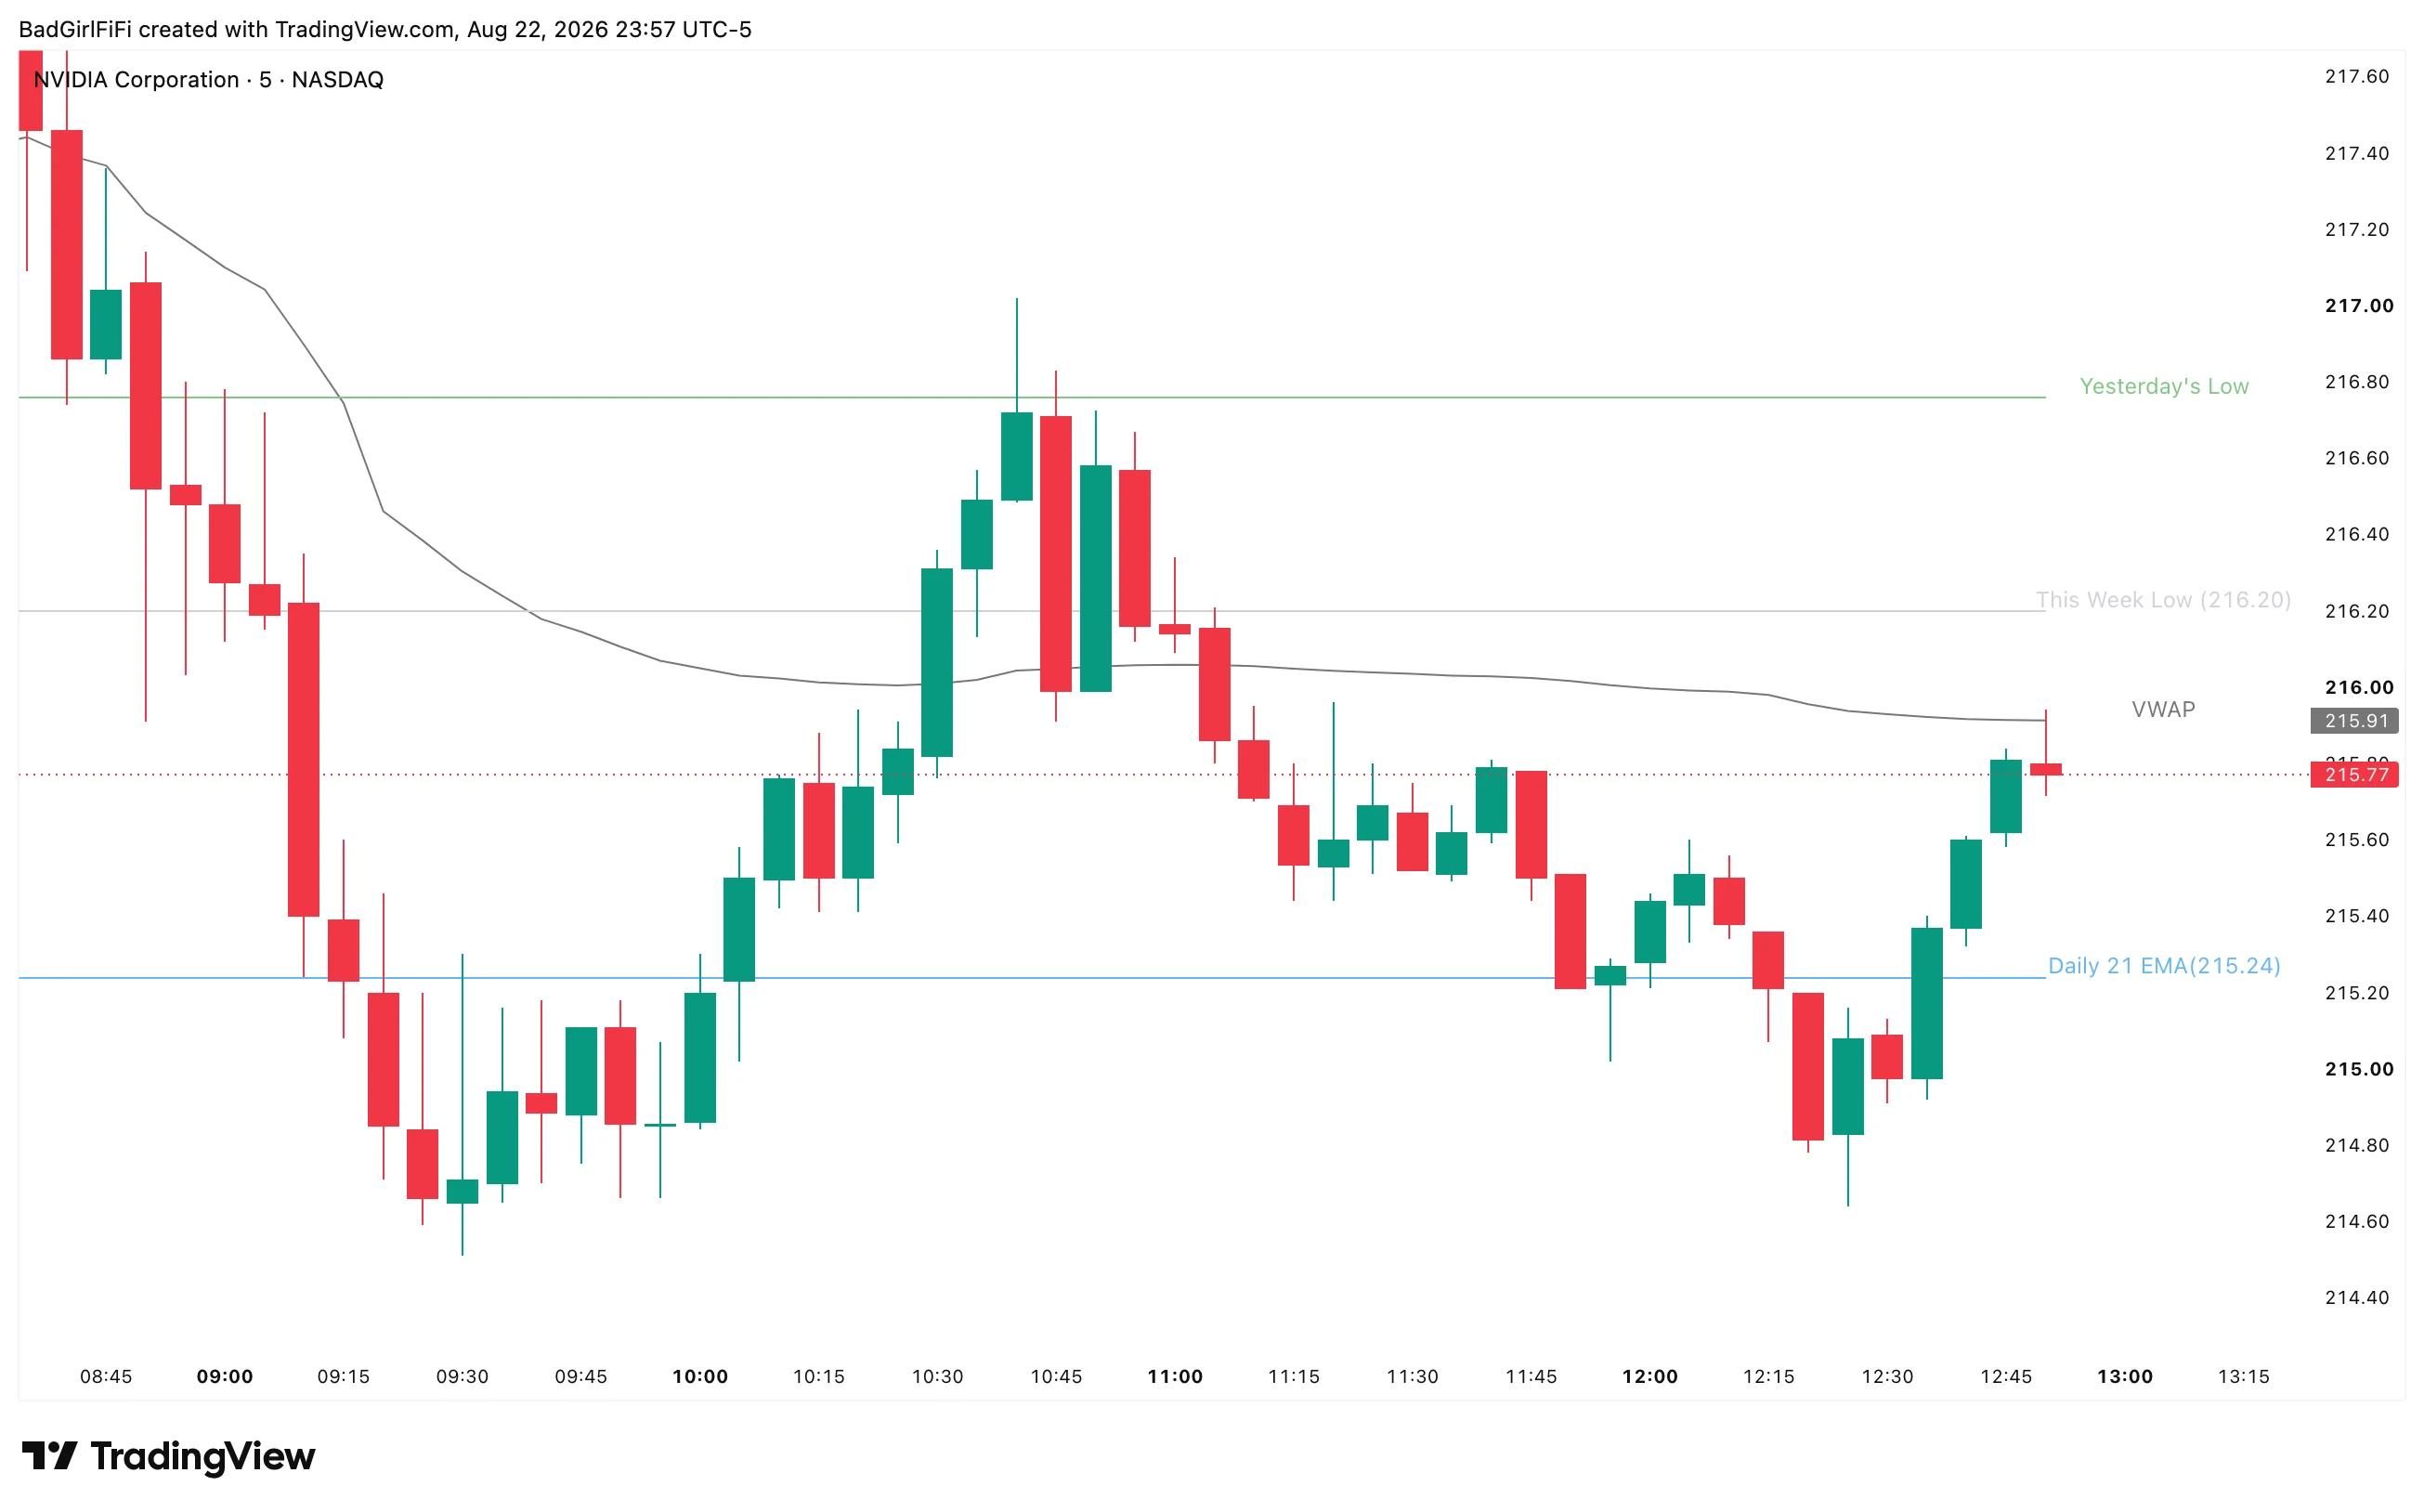 A 5-minute chart. Every line is labelled on the right with its price, so you never have to hover to read a level.
The nine levels
| Level | What it is | Why it’s here |
|---|---|---|
| Today Open | The day’s opening price | The reference everything intraday is measured against — above it is a green day, below it is red |
| Yesterday’s High | Prior day high | The most watched intraday level there is |
| Yesterday’s Low | Prior day low | Its mirror |
| This Week High | Current week’s high so far | Where the week’s range currently tops out |
| This Week Low | Current week’s low so far | And bottoms |
| Last Week High | Prior week’s high | Swing structure, and often untested |
| Last Week Low | Prior week’s low | Same |
| Daily 21 EMA | 21-period EMA of daily closes | The dynamic level — it moves, and it’s where pullbacks in a trend tend to find footing |
| VWAP | Session volume-weighted average price | The day’s fair value, and the reference every institution is measured against |
Eight are fixed horizontal levels. The 21 EMA and VWAP are the two that move — everything else is a line in the sand, those two are the market’s own moving reference.
Lines only span today
Each level is drawn from the start of the current day to the current bar, not stretched across the whole chart.
That’s a deliberate choice and it’s what keeps the chart readable. Levels drawn across all of history turn a chart into a grid — and yesterday’s high stopped mattering to yesterday’s price action, so drawing it there is noise. Scroll back and your historical bars stay clean.
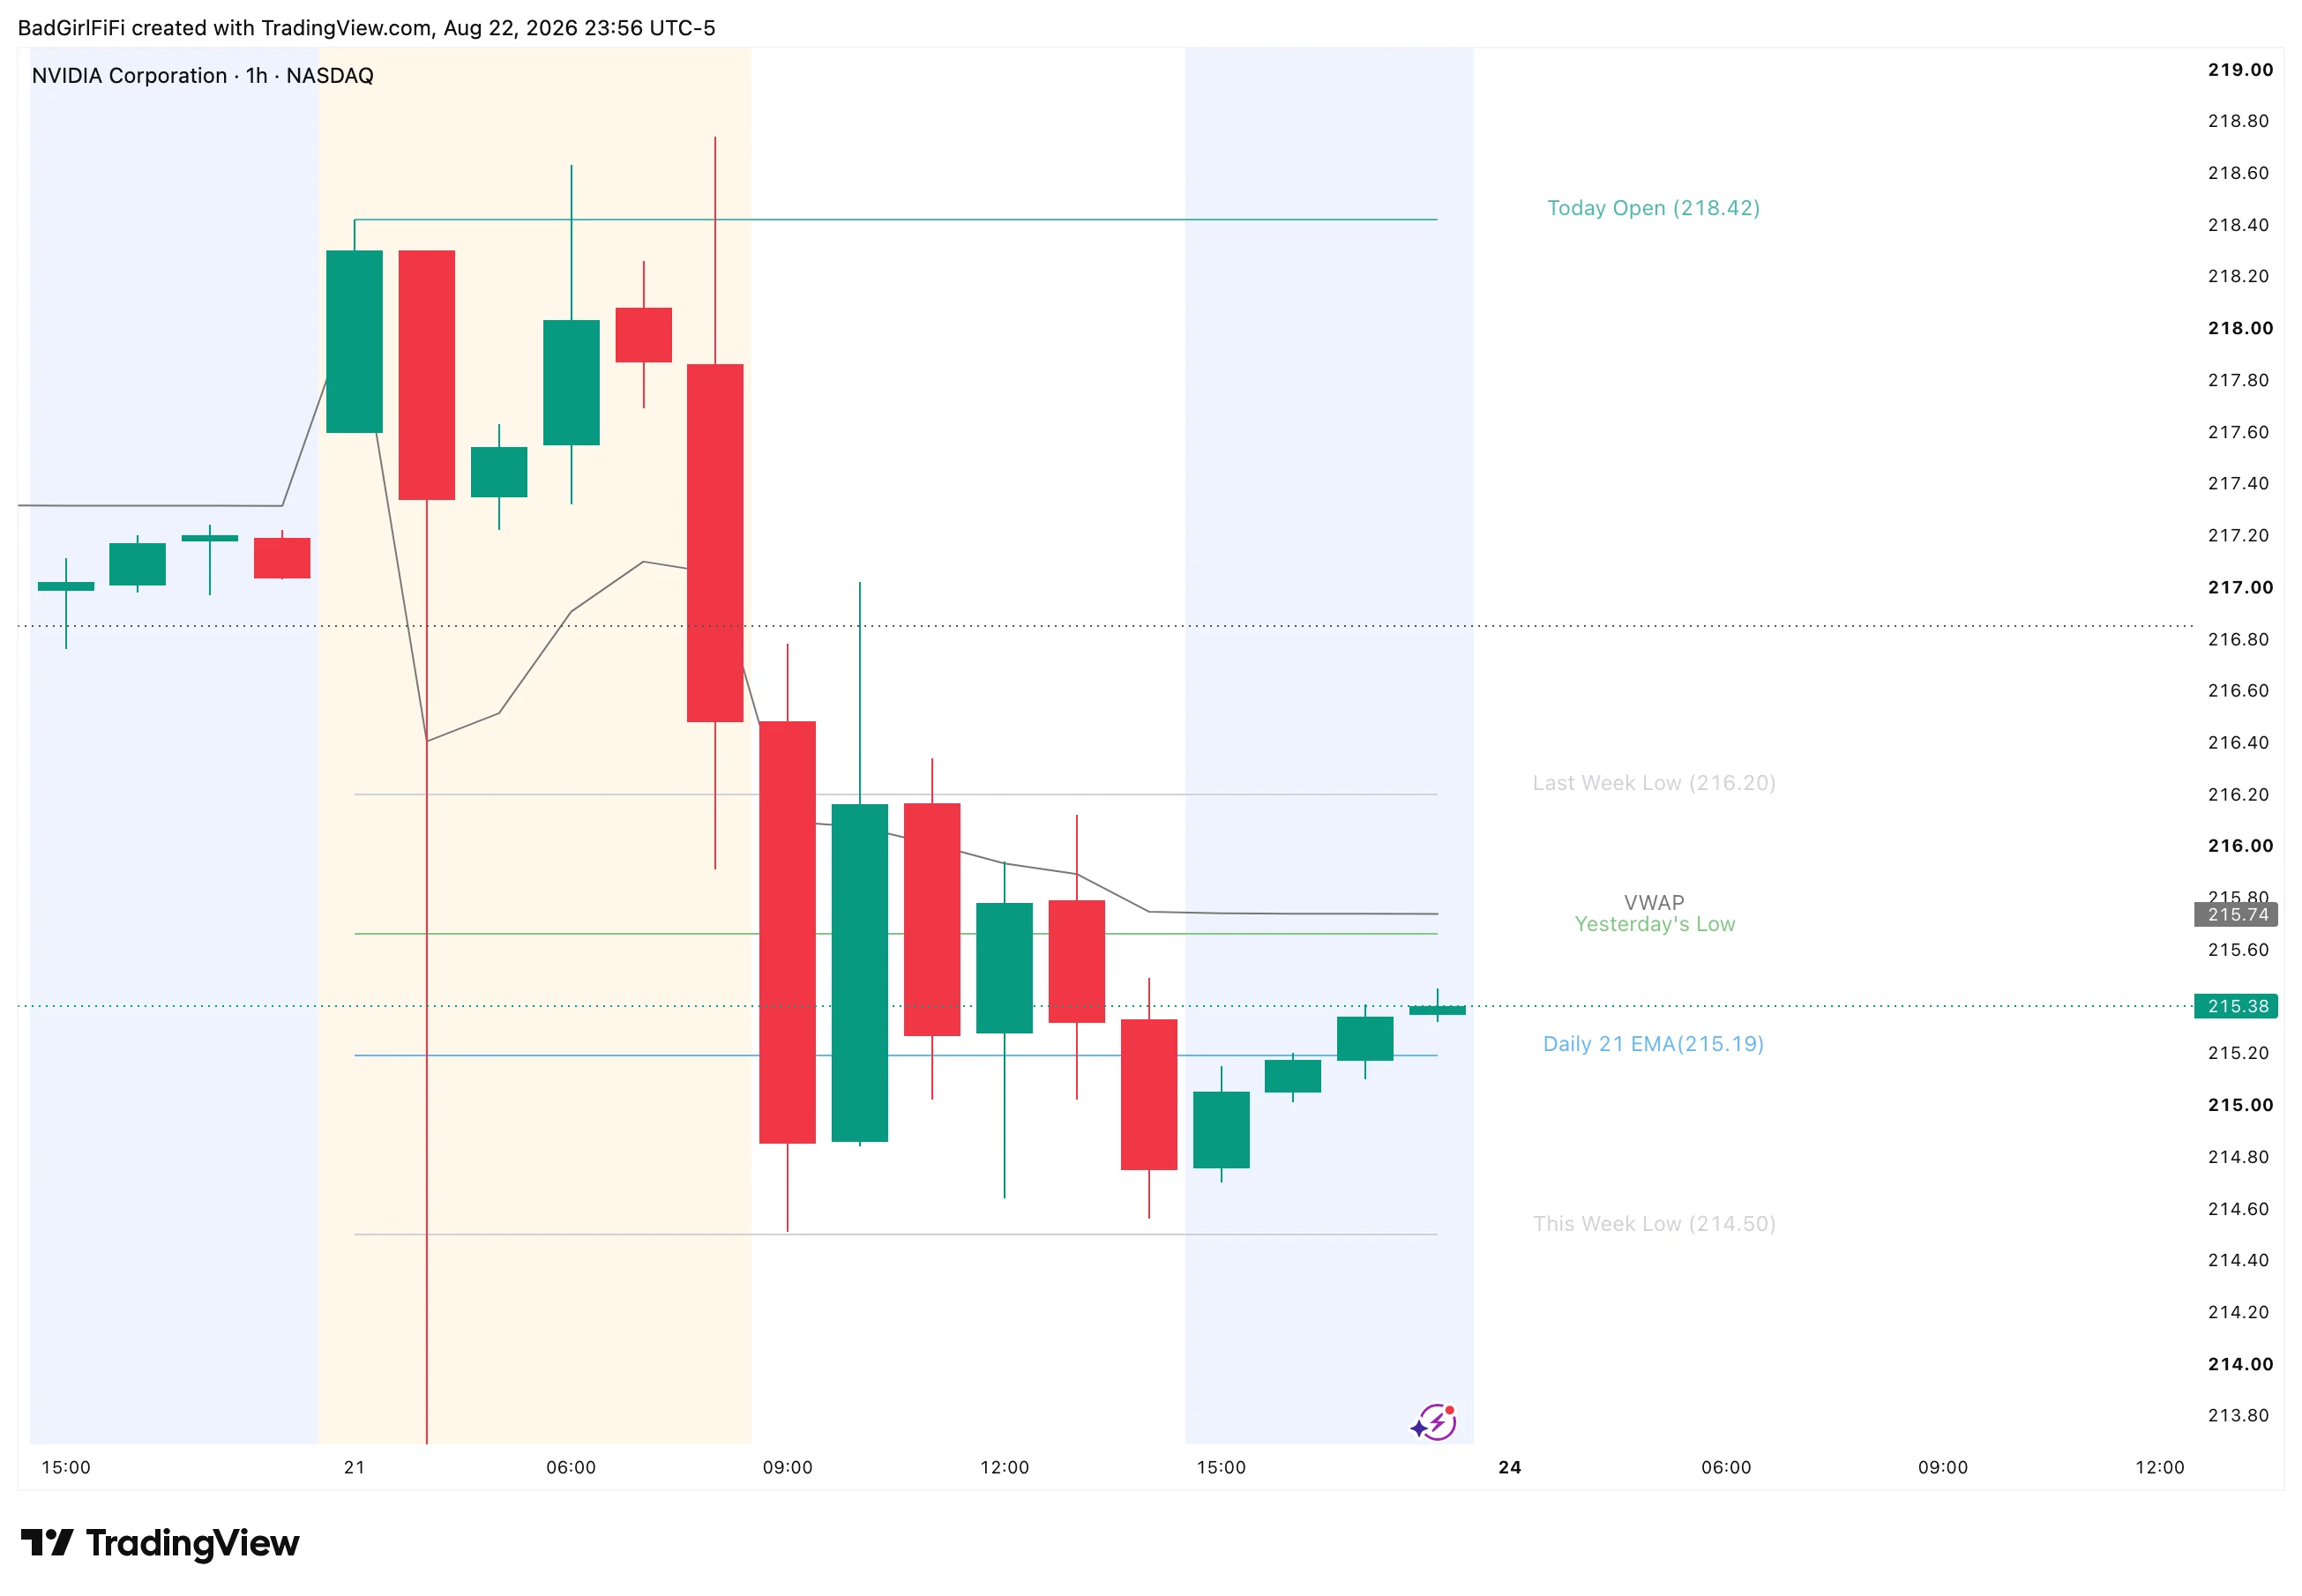 The same levels on a 1-hour chart. Today Open at 218.42, Last Week Low at 216.20, This Week Low at 214.50, the Daily 21 EMA at 215.19.
Labels carry the prices
Every level is labelled to the right of the last bar with its value in brackets — This Week Low (216.20), Daily 21 EMA (215.19). You read the number without hovering, and you can size a trade against a level while looking at price.
Yesterday’s High and Yesterday’s Low are the two exceptions — they label with their name only, no price. Read the value off the price scale for those two.
How to use it
The levels aren’t a strategy — they’re the map your strategy is executed on. Three things they’re consistently good for:
Knowing where the move can run to. A stock breaking out with nothing overhead until last week’s high has room. One breaking out into yesterday’s high has a fight forty cents away.
Judging whether a level actually mattered. Price stalling exactly at the daily 21 EMA is different from price stalling at a round number. When you can see what it stopped at, you learn which levels this particular symbol respects.
Confluence. Levels stacking within a few cents of each other is the single most useful thing this indicator shows you. VWAP sitting on yesterday’s low sitting on the 21 EMA is a location worth trading; any one of them alone is a line.
Run it on an intraday chart. The day-start logic and VWAP are built around a session, so 1 to 60 minutes is where it belongs.
Settings
Every level has its own colour, in a single Line Colors group. That’s the whole settings panel — there’s nothing to tune, because the levels themselves aren’t parameterised.
| Setting | Default |
|---|---|
| This Week High / Low | Pale lilac / pale grey |
| Last Week High / Low | Pale blue-grey / pale grey |
| Today Open | Teal |
| Yesterday’s High | Red |
| Yesterday’s Low | Green |
| Daily 21 EMA | Blue |
| VWAP | Grey |
The default palette is deliberately quiet — the weekly levels are the palest because they’re context, and today’s open, yesterday’s high and yesterday’s low carry the strongest colours because they’re the ones you’ll trade against.
To hide a level you don’t use, set its colour’s transparency to 100 in the colour picker. There are no individual on/off switches — the whole set draws or none of it does.
FAQ
Can I turn off individual levels?
Not with a checkbox. Set the level’s colour transparency to 100 and it disappears.
Why don't the lines extend across the whole chart?
By design. Each level spans only the current day, which keeps historical bars clean. Yesterday’s high wasn’t relevant to last month’s price action.
Why doesn't Yesterday's High show its price in the label?
Yesterday’s High and Yesterday’s Low label with the name alone; the other seven include the value. Read those two off the price scale.
Which timeframe?
Intraday — 1 minute through 1 hour. VWAP and the day-start logic assume a session.
Does it repaint?
The fixed levels — yesterday’s high and low, last week’s high and low, today’s open — are settled values and don’t change. This week’s high and low naturally extend as the week makes new extremes, and VWAP and the 21 EMA move because that’s what they do.
Does it work on futures and crypto?
The levels calculate on anything with daily and weekly data. Sessions differ, so the day boundary follows the symbol’s own session.
Ready for the full engine?
This one is free. The Trade Qualification Engine is the paid suite it was built alongside.