
Overview
TQE Swing is a trade quality filter, not a prediction tool. It does one job: identify swing setups that meet a strict, multi-factor qualification standard — and ignore everything else.
It scores both directions at once. Every bar it builds a separate bull case and bear case from the same set of tests, grades each 0–100, and declares a winner only when one side is clearly ahead. Often the honest answer is neither, and it says so rather than manufacturing a trade.
You don’t need more trades. You need better ones. TQE Swing helps ensure that when you do trade, the market context is stacked in your favor.
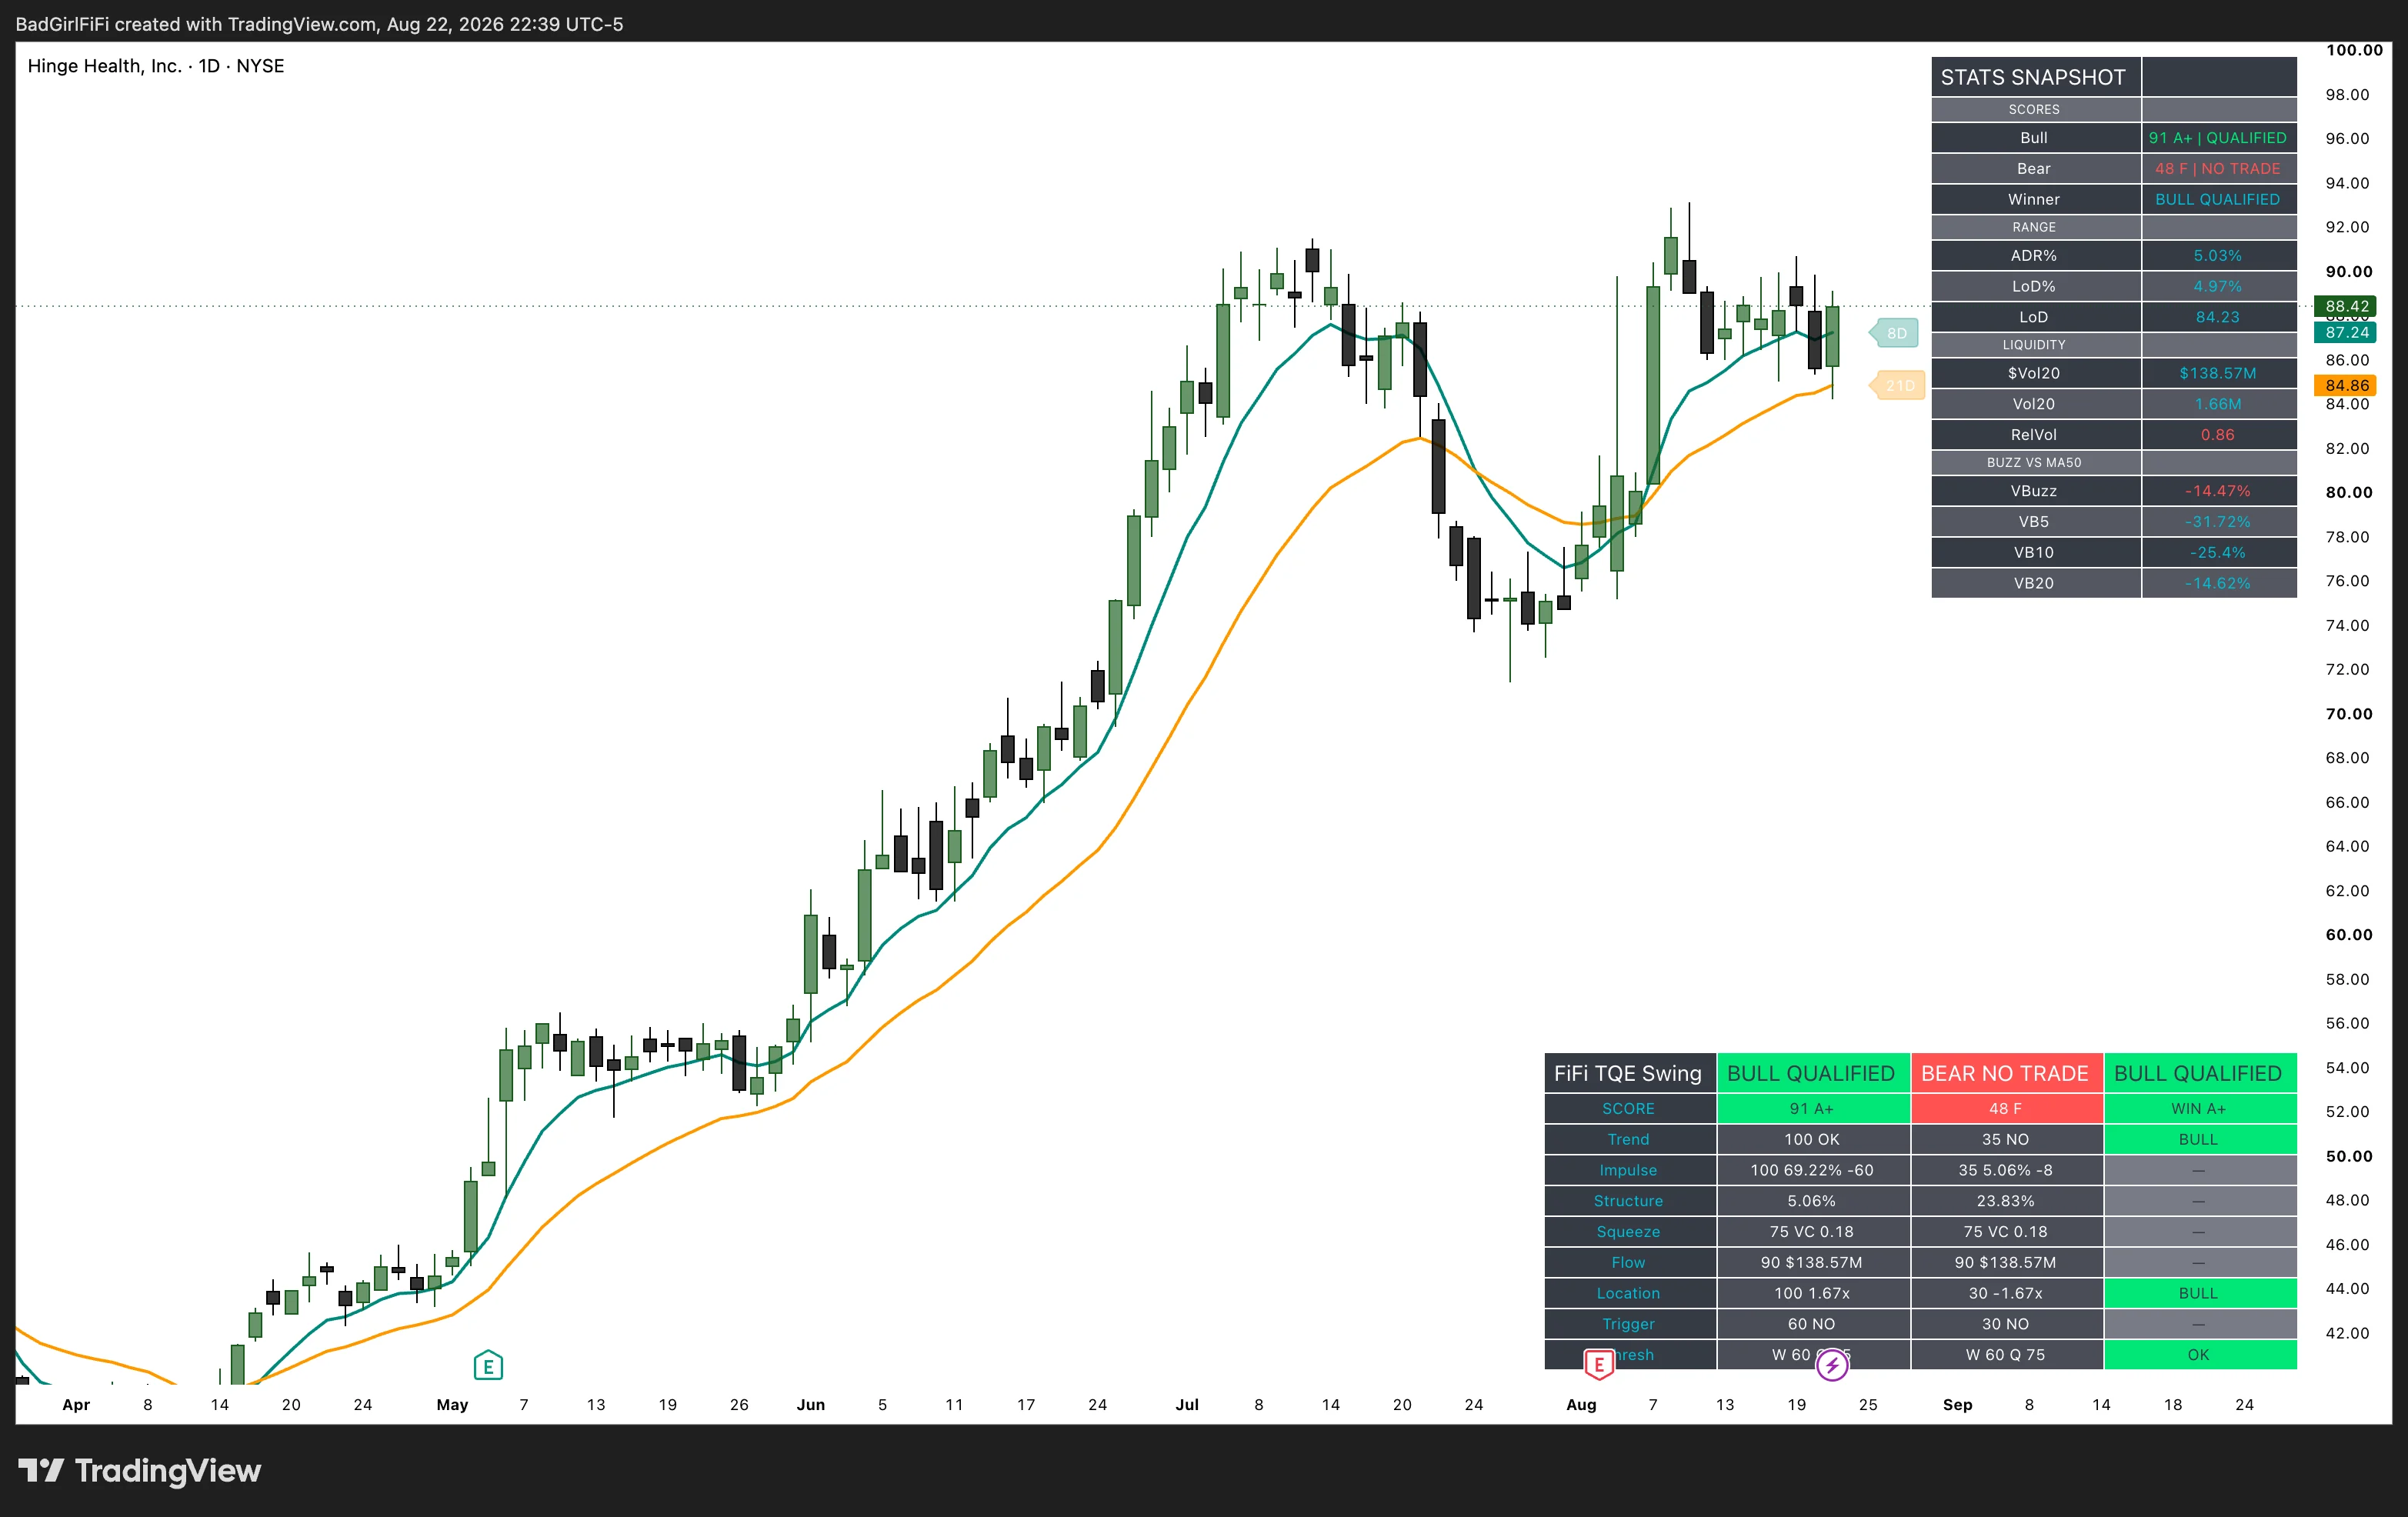 Stats Snapshot top right, Qualifier bottom right. Bull 91 A+, Bear 48 F, winner BULL QUALIFIED.
What it is not
- Not a signal generator
- Not a prediction engine
- Not a replacement for risk management
- Not designed for scalping or random entries
TQE Swing answers “is this trade worth my attention?” You answer “how do I trade it?”
It runs on the daily
The engine scores daily bars, and both tables only draw on daily charts and above.
This isn’t a limitation to work around — it’s the design. One-bar signals are unreliable for swing trading, and every test here is built on daily structure.
Leave it loaded. Drop to a 15-minute chart and the tables simply don’t render — the indicator sits quietly in the background costing you nothing, and reappears the moment you go back to the daily. There’s no reason to remove and re-add it as you move around.
If you’ve added it and the chart looks empty, check your timeframe before anything else. That’s the answer nearly every time.
Adding it to your chart
New to adding indicators on TradingView? Start with the setup guide, then come back here.
Set the chart to Daily and both tables appear immediately. The defaults are the intended configuration — the thresholds, lookbacks and weights were tuned against each other, and moving one in isolation usually makes the score less meaningful rather than more.
Reading the two tables
The Qualifier
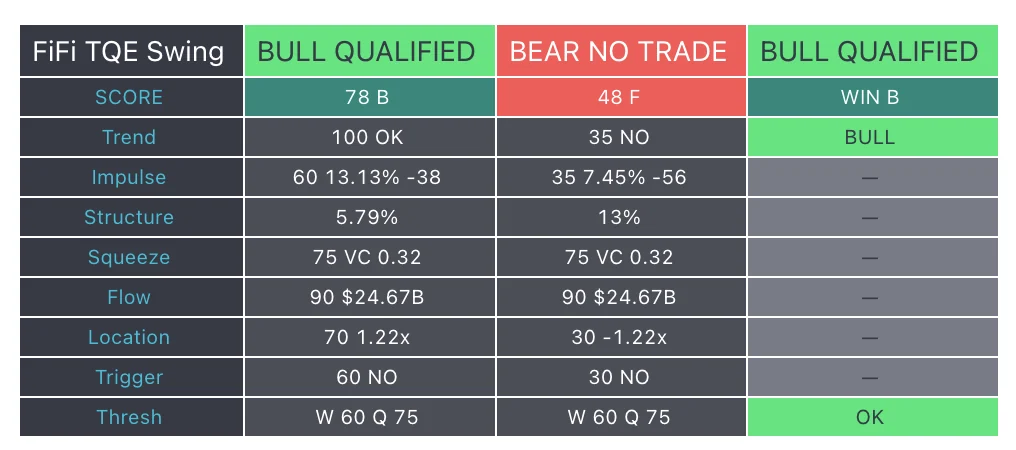
Four columns: the module, the bull case, the bear case, and the winner.
| Row | What it tells you |
|---|---|
| Top row | State for each side — QUALIFIED, WATCH or NO TRADE |
| SCORE | The 0–100 score and its letter grade |
| Trend | Module score, and whether the trend test passed outright |
| Impulse | Module score, the size of the thrust move, and how far back the extreme printed |
| Structure | How deep the current pullback or bounce is |
| Squeeze | Module score and the volatility contraction reading |
| Flow | Module score and 20-day average dollar volume |
| Location | Module score and how extended price is, in ADR units |
| Trigger | Module score, and whether a confirmation event is present |
| Thresh | Your WATCH and QUALIFIED cutoffs, and whether the winner cleared them |
A score and a pass are different things. A module can score well and still read NO — passing requires every condition inside it, while the score gives partial credit. The number tells you quality; OK / NO is a hard gate.
Read the column, not just the headline. Two names can both score 82 with completely different profiles: one strong everywhere and slightly late, another perfect on location but with momentum fading. The module column is where you find out which one you’re looking at.
Structure has no score of its own. It’s a readout — the base depth it reports is already being graded inside Impulse. It earns a row because that number matters to you directly: a shallow pullback and a deep one can both qualify, but they’re very different trades.
The bars-since figure on Impulse is negative. 69.22% -60 means price sits 69% above a low that printed 60 bars ago. The minus sign is an offset, not a deficit.
The Stats Snapshot
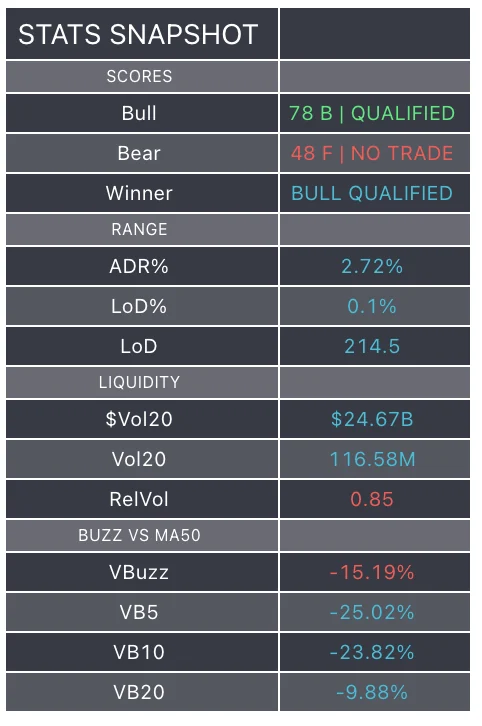
Unscored context, worth seeing before you act.
| Group | Fields |
|---|---|
| SCORES | Bull, Bear and the Winner, each with grade and state |
| RANGE | ADR% (average daily range), LoD% (how far price sits above the bar’s low), LoD (that low) |
| LIQUIDITY | $Vol20 and Vol20 — 20-day average dollar and share volume — plus RelVol against the 20-day average |
| BUZZ VS MA50 | VBuzz, VB5, VB10, VB20 — current and recent volume against the 50-day average |
ADR% is the first number to read. It sizes everything else. Location measures extension in ADR units, and your stop should be sized against it too — a 5% ADR name and a 1.5% ADR name need very different position sizes for the same dollar risk.
Ignore the red on RelVol and VBuzz. Both color by market convention: green above average, red below. A quiet base therefore paints red while scoring well — the A+ example above shows RelVol at 0.86 in red. Read the numbers, not the colors. For this model, below-average volume in a base is the point.
What the engine evaluates
Six independent tests, scored separately for the long case and the short case, then blended into one number. A setup scores well only when most of them align at the same time.
Trend — the dominant directional bias, measured through a stack of moving averages running from short to long, where price sits within it, and which way the intermediate average is heading. Weighted most heavily of the six, because most failed swing trades happen against trend and this is the cheapest possible way to find that out.
Impulse — whether a real move happened, and whether it has paused without giving it all back. Strong swings expand, pause, then expand again; Impulse tests the first two. A large thrust that’s already surrendered most of its gains fails, because at that point you aren’t buying a pause, you’re catching a decline.
Structure — how deep the current pullback or bounce runs. Reported for your judgment rather than scored separately.
Squeeze — volatility compression. Recent range measured against the preceding period, and against price itself. Compression precedes expansion, so this is the module looking for a market coiling. Not directional: a coiled stock is coiled whichever way it eventually breaks.
Flow — liquidity and participation. Two parts: a hard liquidity floor that a name must clear to be tradable at all, and a read on how volume is behaving through the base. Also not directional.
Location — where price sits relative to its recent pivot and its intermediate average. This is the module that stops you chasing. A stock can have a perfect trend and perfect momentum and still be far too extended to enter, at which point the setup is good and the entry is bad.
Trigger — the confirmation event. Momentum inside a healthy band plus a directional bar backed by participation. Weighted lightest of the six, deliberately.
Two things about Flow worth knowing
Flow rewards volume going quiet, not volume surging. A base still trading heavy is a base with sellers working; a base where volume falls away has absorbed its supply and the people who wanted out are gone. Dry-up is the tell that a pullback has finished rather than paused mid-flight.
Expansion has its own place — it’s what Trigger looks for, on the bar you actually enter. Quiet through the base, loud on the break.
This is why a strong setup shows negative buzz numbers in the Stats Snapshot. VB5 at −31% isn’t a warning; it’s Flow’s thesis showing up in the data.
Two things about the scale
Qualification describes the environment, not the entry. A setup can be QUALIFIED with Trigger reading NO, and frequently is — the A+ example above has no trigger present. That’s why Trigger carries the least weight. The engine’s job is to tell you the conditions are right; timing the entry stays yours.
The bottom of the scale is compressed. Every test awards partial credit rather than zero, so a liquid stock with genuinely no case in a direction still lands in the high 40s or low 50s rather than near zero. A bear reading of 48 doesn’t mean “the short failed catastrophically” — it means “no short case exists here.” Read the low end as a floor, not a measurement. The meaningful separation happens from about 70 upward.
Grades, states and the winner
Grade is a plain band on the score:
| Grade | Meaning |
|---|---|
| A+ | Exceptional alignment |
| A | High probability setup |
| B | Good setup |
| C | Moderate quality |
| D | Weak conditions |
| F | Avoid trading |
State is measured against your own cutoffs, and it’s what the top row reports:
| State | Meaning |
|---|---|
| QUALIFIED | Meets the standard |
| WATCH | Developing — watchlist it |
| NO TRADE | Not aligned |
Winner and Edge Delta
The winner is not simply the higher score. In the default mode, one side has to beat the other by more than the Edge Delta to be declared the winner. Inside that margin the result is MIXED — and with If Mixed: Force NO TRADE enabled, MIXED reports as NO TRADE no matter how high either raw score is.
That’s the engine refusing to pick a side it can’t actually distinguish. Two strong scores a few points apart aren’t a setup; they’re noise with good numbers attached.
Three modes:
- Auto (Best Side) + Edge Delta — default. Requires the margin.
- Auto (Best Side) — higher score wins outright.
- Show Both — scores both sides for comparison without the margin.
Alerts and the Discord feed
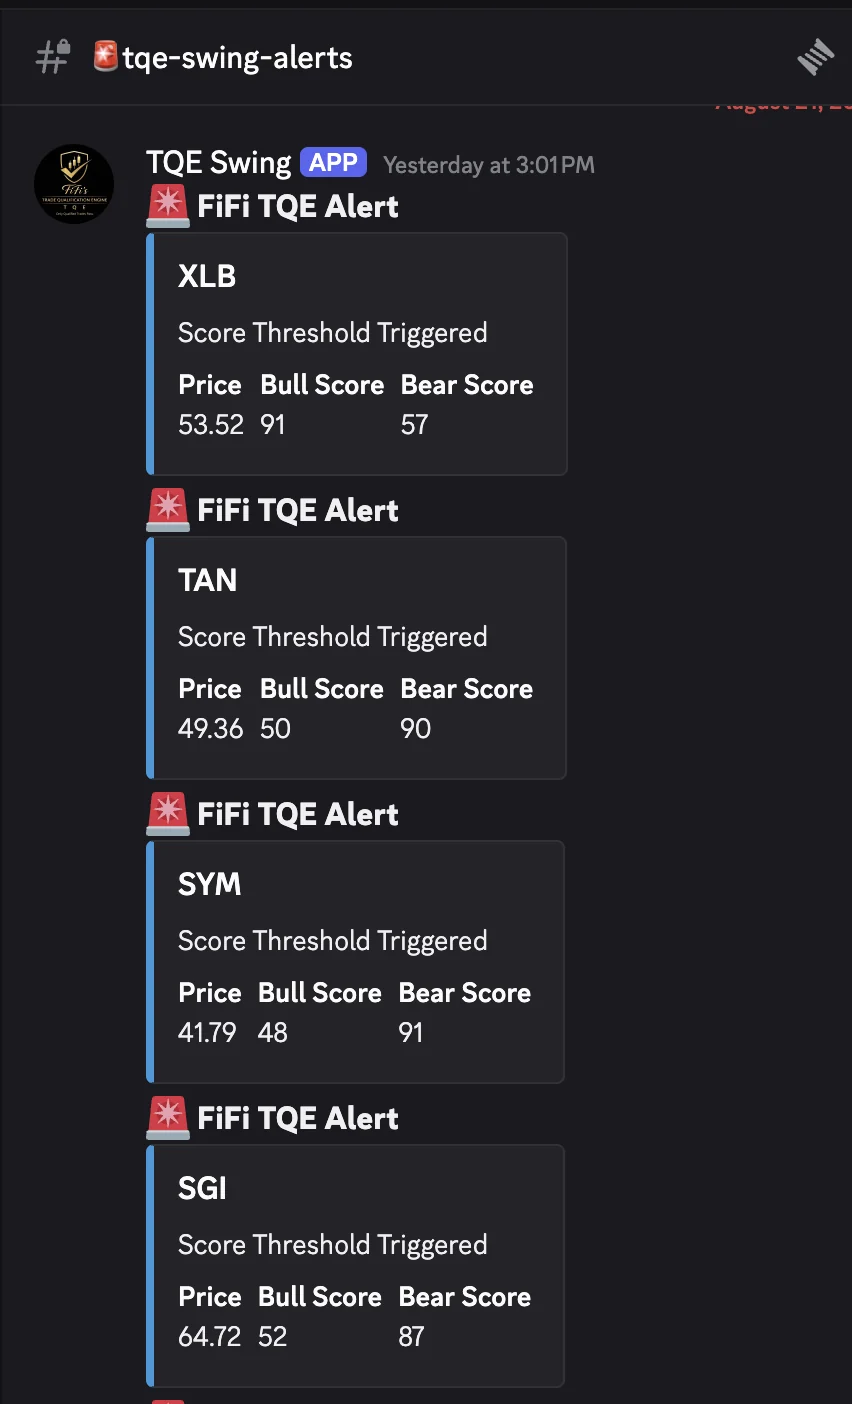
Alerts fire at the close of each trading day, because the engine scores daily bars. Nothing fires intraday, and nothing needs watching during the session — the day’s qualified names land after the close, ready for you to review that evening.
Each card carries the ticker, the price, and both scores, so you can see the winner and the margin at a glance. TAN at 50 bull / 90 bear is a short candidate; XLB at 91 bull / 57 bear is a long. No need to open the chart to know which direction the engine is pointing.
Three alert conditions are available:
| Alert | Fires on |
|---|---|
| Bull Score Hit | The long case clearing your threshold |
| Bear Score Hit | The short case clearing your threshold |
| Any Score Hit (JSON) | Either side — formatted as a Discord embed |
The third is what feeds the members’ channel: point a TradingView alert at a Discord webhook and the payload arrives as a formatted card rather than a wall of text.
Alert settings
| Setting | What it does |
|---|---|
| Enable | Master switch for all three conditions |
| Fire Mode | Fire on every qualifying bar, or only on the bar a name first qualifies |
| Bull score ≥ / Bear score ≥ | Alert thresholds, set independently per side |
| Bull require / Bear require | Optionally also require WATCH+ or QUALIFIED only |
| Require Trigger module | Only alert when a confirmation event is present |
Alert thresholds sit above the qualification cutoff on purpose. QUALIFIED is worth watching. A top-end score is worth interrupting someone for.
Fire Mode is the setting to think about for a feed. “Every Bar” re-posts every day a name stays qualified, so a strong setup basing for two weeks becomes ten messages. “On Cross (Newly Qualified Only)” posts once, the day it first crosses. For a members’ channel that’s usually what you want.
Settings reference
Every parameter below is adjustable, but the defaults are tuned as a set. Change them only with a specific reason.
Model parameters
Each module exposes its own lengths, lookbacks and sensitivity levels, plus one hard liquidity floor that a name must clear to be considered at all.
These are tuned as a set. The windows, thresholds and weights were calibrated against each other over a long testing period — moving one in isolation almost always makes the score less meaningful rather than more. If a setup isn’t scoring the way you expect, the answer is usually that the setup isn’t as good as it looks, not that a parameter needs adjusting.
Thresholds and weights
| Setting | What it controls |
|---|---|
| QUALIFIED ≥ / WATCH ≥ | The score cutoffs behind each state |
| Module weights | Relative weight of each module in the blended score |
Weights normalize against their own total, so they don’t need to add to 100.
Direction and display
| Setting | What it does |
|---|---|
| Mode | How the winner is chosen |
| Edge Delta (points) | The margin one side must win by |
| If Mixed: Force NO TRADE | Reports MIXED as NO TRADE |
| Mobile Mode | Drops the Stats table and the Winner column, shrinks text |
| Show Qualifier / Show Stats | Table visibility — still subject to the daily-or-higher rule |
| Qualifier / Stats Position | Which corner each table occupies |
| Table Text Size, Cell Padding, Compact Mode | Table density |
Every color in both tables is configurable — states, grades, score rows, alternating backgrounds. State and score cells default to auto contrast, picking black or white text against whatever background you choose. Leave that on unless you have a reason not to.
How to use it
- Scan or filter with TQE Swing across your universe
- Focus only on top-scoring names
- Apply your own entry trigger, stop logic and position sizing
- Execute only when price confirms your plan
The engine narrows the field. It does not take the trade.
FAQ
I added it and nothing appears.
You’re on an intraday timeframe. Both tables need daily or higher. Switch to Daily — and you can leave the indicator loaded while you work on lower timeframes; it just won’t draw.
When do alerts fire?
At the close of each trading day. The engine scores daily bars, so there’s nothing to watch intraday.
Why do Squeeze and Flow show the same number on both sides?
Neither is directional. Volatility compression and volume behavior describe the symbol, not a long or short case.
Bull is 82 and Bear is 79. Why does it say NO TRADE?
Edge Delta. Neither side clears the other by enough, so the result is MIXED, which is forced to NO TRADE by default. Two close scores mean the engine can’t tell the difference — and that’s information.
Why is the losing side never much below 50?
Every test awards partial credit rather than zero, and clearing the liquidity floor is worth a substantial share of Flow on its own. The meaningful range is roughly the 70s upward.
Can a QUALIFIED setup have Trigger reading NO?
Yes, and it’s common. Qualification is about environment. The entry is your job.
Does it repaint?
No. Everything is calculated from the chart’s own timeframe, with no higher-timeframe requests and no lookahead.
Can I use it for day trading?
Not this one — it’s built on daily structure.
Walkthroughs
Where this fits
Every indicator in the engine is documented to the same standard.