
Overview
The Trend Spine is a market regime and trend-structure indicator. Its job is not to predict tops or bottoms. Its job is to answer one question:
What state is the market in right now — and should I be pressing, managing, or waiting?
It makes trend health, strength and transitions visually obvious, so you stop fighting trends, stop overtrading chop, and stop misreading pullbacks as reversals.
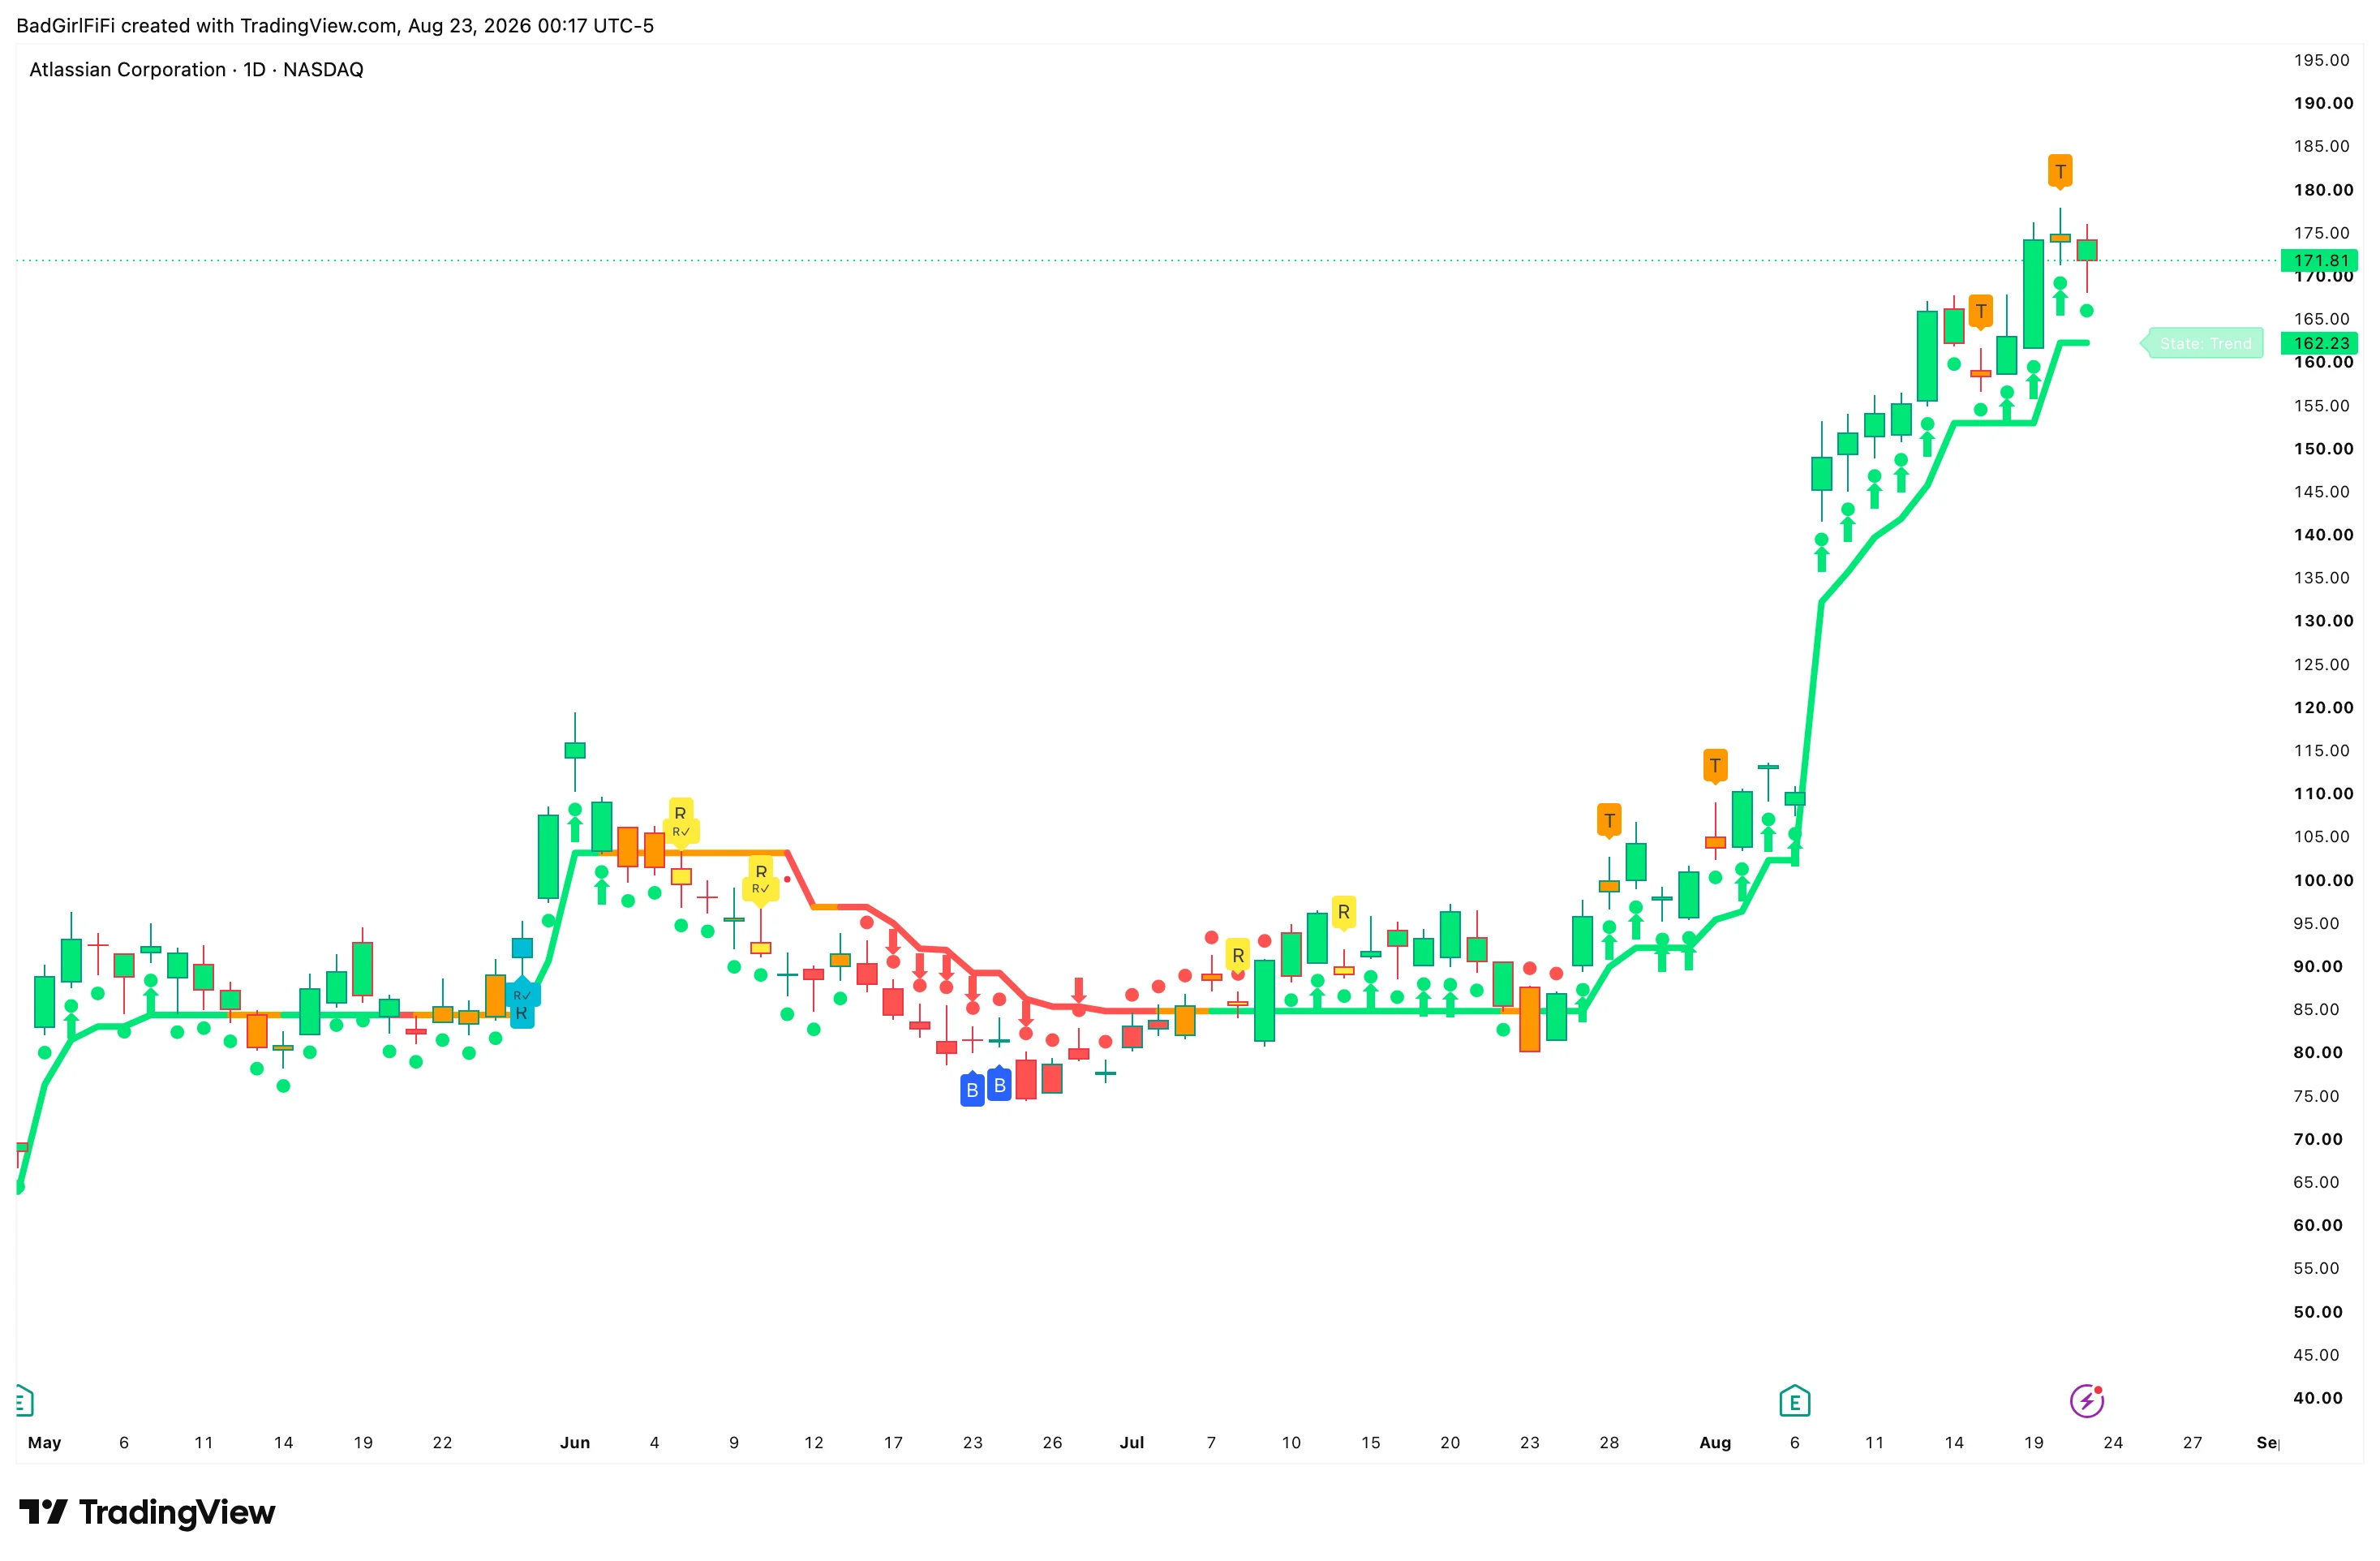 The spine carries the regime; dots carry the pressure; tags mark structural events.
The mental model
| Layer | What it gives you |
|---|---|
| Spine | Direction |
| Dots | Strength |
| Tags | Context |
| State | Environment |
| Price | Confirmation |
Trends don’t end suddenly — they weaken, transition, and then resolve.
Everything is built around that. The indicator identifies dominant control, warns when that control is under stress, and confirms when it’s been reclaimed or broken.
Treat each layer as its own system. If you’re trend trading, read the spine and the bars. If you’re hunting turns, read the tags. They’re designed to work together but they don’t have to agree before either one is useful.
1 · The spine — direction
The primary visual anchor.
| Spine | Meaning |
|---|---|
| Green | Bullish regime. Buyers in control, continuation favoured |
| Red | Bearish regime. Sellers in control, downside continuation favoured |
| Orange / flat | No dominant control. Compression or transition — stand down or reduce size |
Trade with the spine, not against it.
It is built to keep you in the move
The spine and the trend bars are deliberately slow to flip. That means there will be pullbacks where the colour stays green while price is falling, and bounces where it stays red.
That’s the design, not a fault. A regime layer that flipped on every counter-move would chop you out of every trend it put you into. The cost of holding through a two-bar wobble is small; the benefit is that when a real trend runs, the colour holds for the entire move and you’re still in it.
Judge the spine zoomed out, not bar by bar. Over a long trend it will have stayed one colour throughout while price did plenty of uncomfortable things inside it. That’s the whole point.
2 · The dots — strength
Dots visualise internal trend pressure and persistence.
Green dots — bullish pressure, higher-lows behaviour, continuation intact. Red dots — bearish pressure, lower-highs behaviour, downtrend intact. Mixed or flipping dots — compression, an unresolved battle, a higher-risk environment.
Strong trends keep their dots consistent. Weak trends flip them constantly.
You don’t need to read a value — you only need to notice whether the dots are steady or arguing with themselves.
3 · The tags — and the confirmation rule
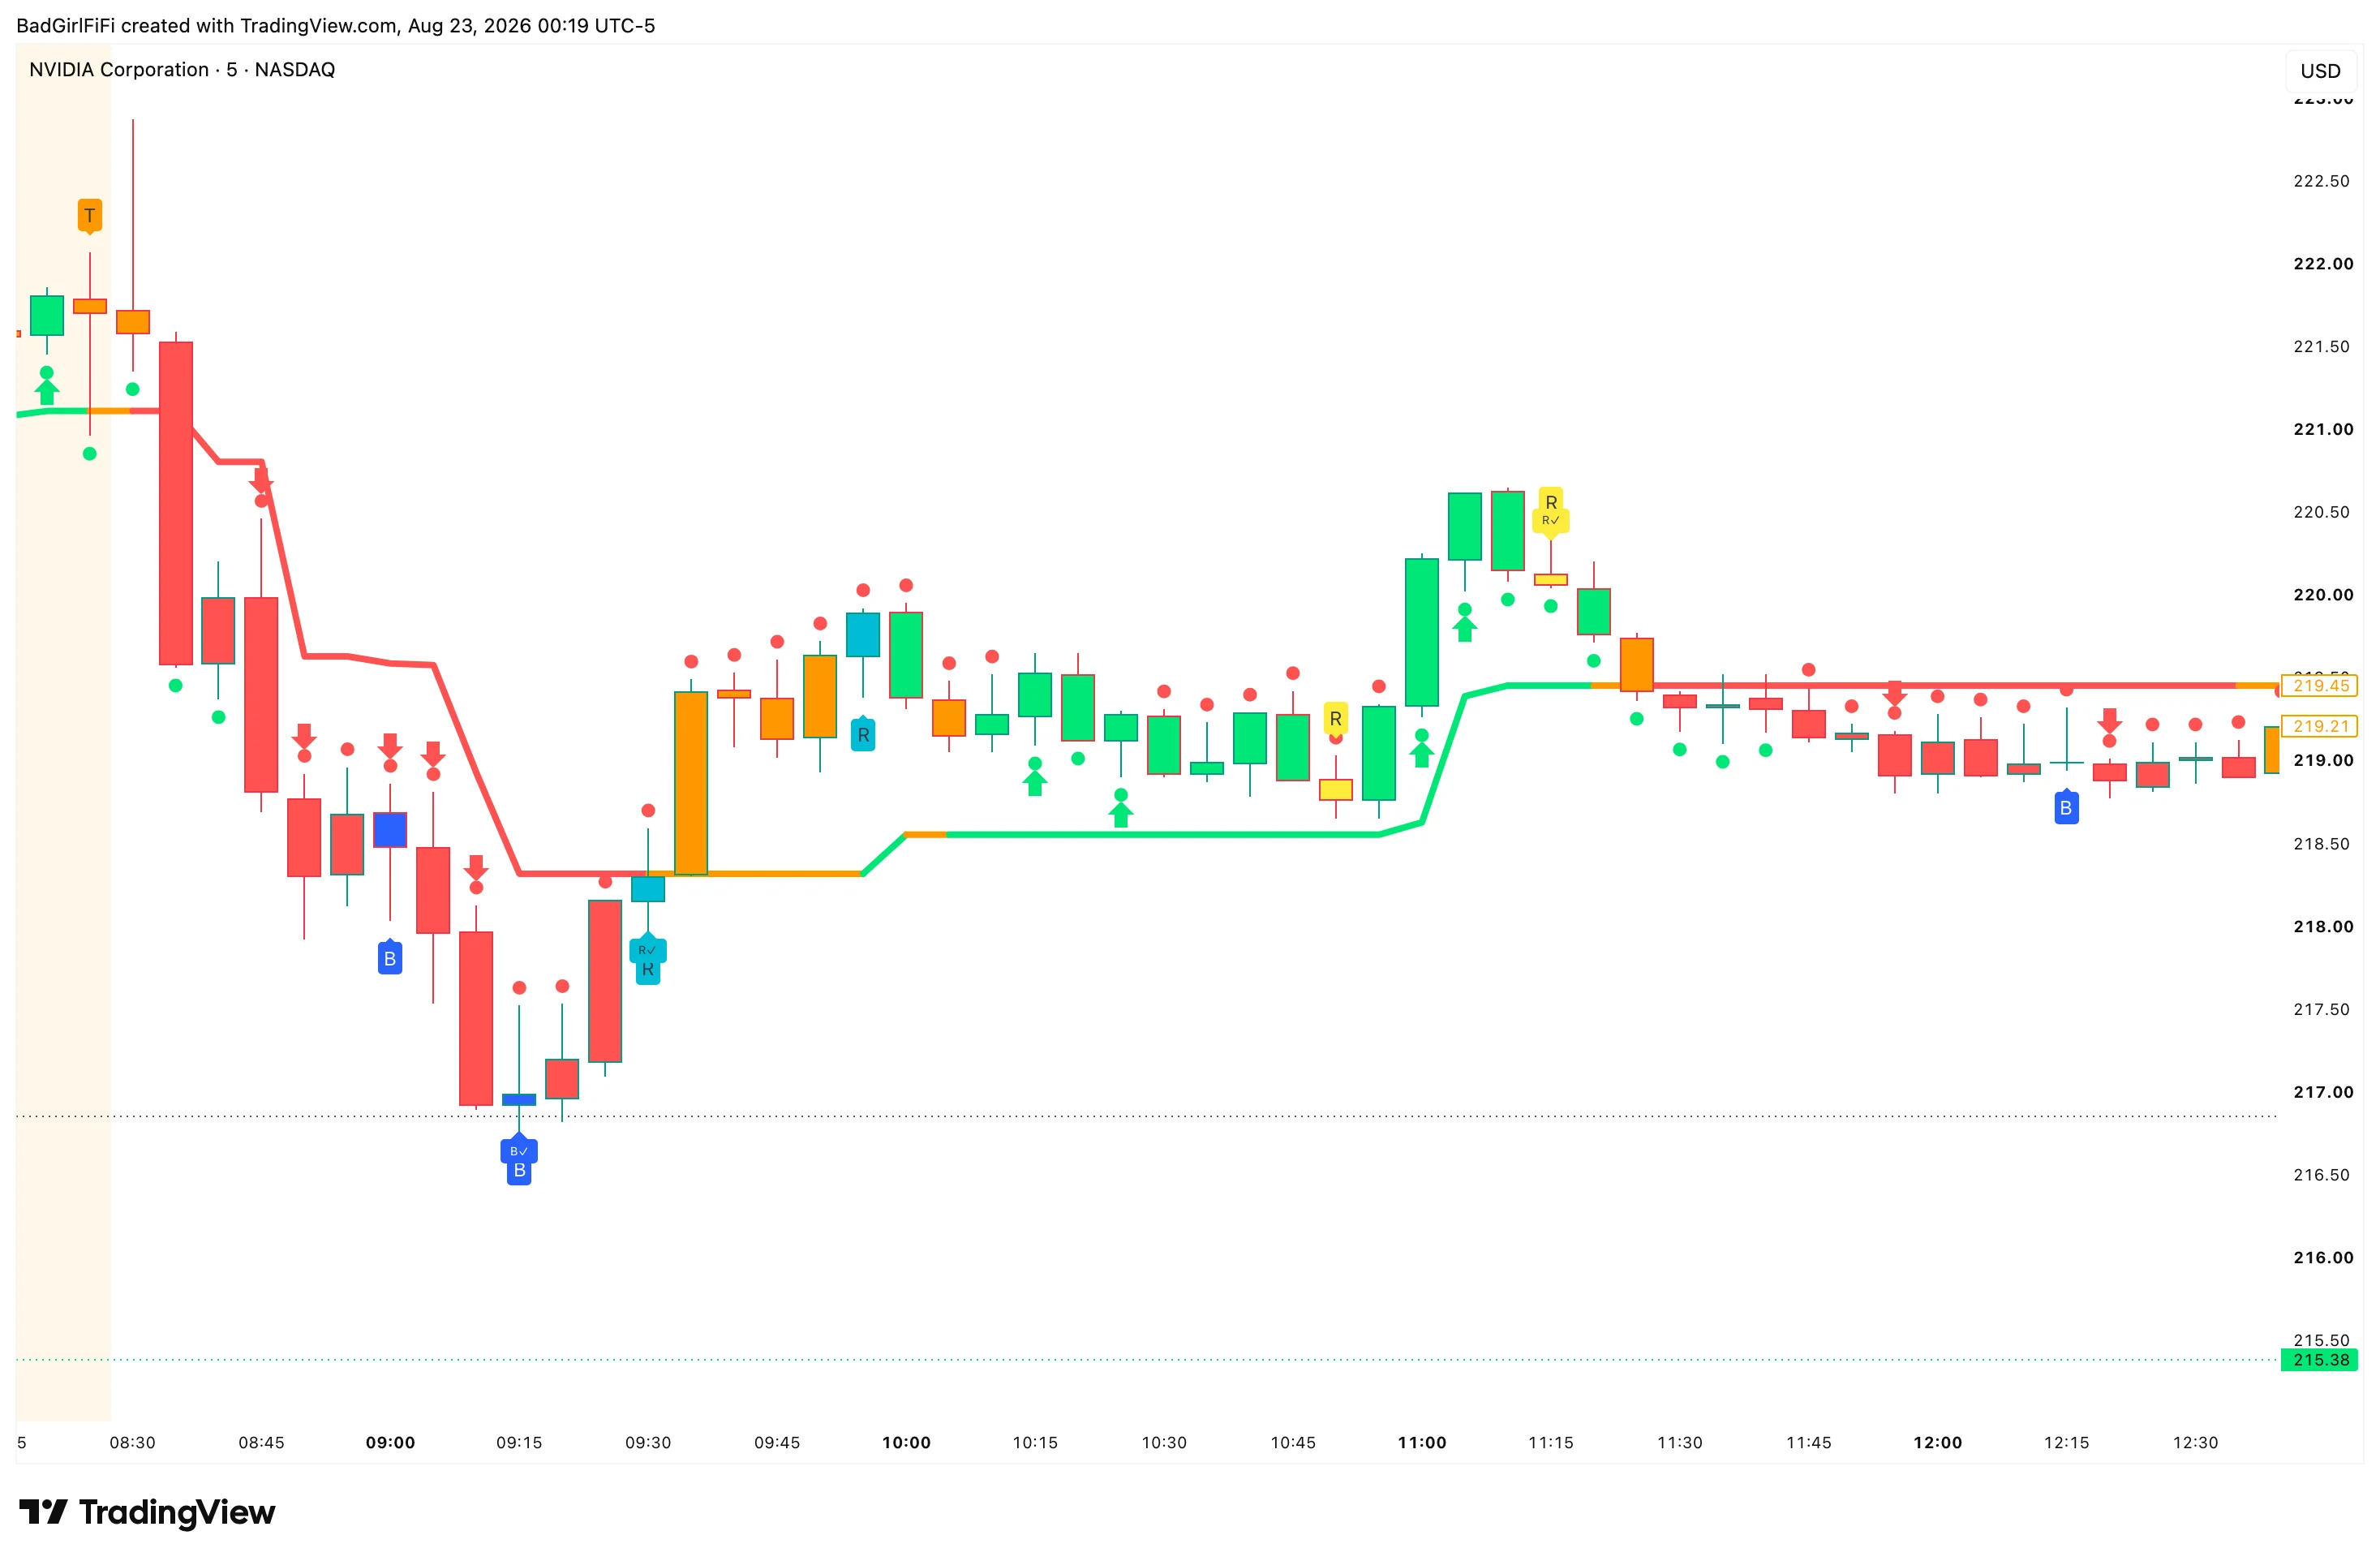 Tags mark structural events. They appear rarely by design.
| Tag | What it marks | Direction it points |
|---|---|---|
| T (orange) | Potential local top | Downside |
| B (blue) | Potential local bottom | Upside |
| R (yellow) | Potential bearish reversal | Downside |
| R (turquoise) | Potential bullish reversal | Upside |
| ✓ | That tag was confirmed | — |
A tag on its own is a candidate, not a trade. What separates the ones that work from the ones that don’t is a single rule — and the indicator applies it for you.
The rule
Look at the bar after the tag. It has to close beyond the tag bar’s wick, in the direction the tag points.
- For a downside tag (T, or yellow R): the next bar must close below the tag bar’s lower wick.
- For an upside tag (B, or turquoise R): the next bar must close above the tag bar’s upper wick.
Close beyond the wick — not merely beyond the body, and not an intrabar poke that doesn’t hold. When that happens, the tag earns its ✓.
Each tag type gets its own confirmation window, and confirmation is judged on bar close only by default — that’s the setting to leave alone — an intrabar reading that reverses before the close was never confirmation.
Failed tags carry information too
This is the part most people miss. When a tag fails to confirm, the opposite outcome is common.
A topping tag whose next bar closes up through the wick isn’t just a dud signal — it’s frequently the start of a move in the other direction. The market tested the level, failed to follow through, and resolved the other way.
So an unconfirmed tag isn’t noise to be discarded. It’s a tell, and it’s why the indicator shows unconfirmed tags at all rather than hiding them until they prove out.
A tag says “here’s a candidate.” The next bar says whether it’s real. Both readings are tradeable.
Tags cluster where it matters
Two tags in the same area — a top and a bearish reversal within a few bars — is a stronger statement than either alone. Clustering means the market tested that zone more than once and found sellers, or buyers, each time. Those are the areas worth marking on your chart.
4 · The state label — environment in plain English
Rather than making you infer conditions, the Trend Spine states the regime outright.
| State | Conditions | Best approach |
|---|---|---|
| Trend | Clear directional control, spine and dots aligned | Trend trades, pullback entries, holding winners |
| Pullback | Counter-move inside an intact trend | Look for continuation, not reversal |
| Transition | Control weakening or shifting, mixed dots, tags clustering | Reduce size, wait for confirmation, avoid aggressive entries |
| Chop / Range | No clear control, flat spine, choppy price | Patience. Let structure resolve |
Most traders lose money by trading during Transition or Range as if it were Trend.
That’s the reason the state label exists. Everything else on a chart can be talked into looking like a setup; a label reading Transition is difficult to argue with.
5 · Price interaction — the final arbiter
The most important confirmation is how price behaves around the spine.
Healthy trends — pullbacks respect the spine, wicks reject through it, closes favour trend direction.
Weak trends — price chops through the spine, no follow-through, frequent state changes.
The cleaner price respects the spine, the stronger the trend.
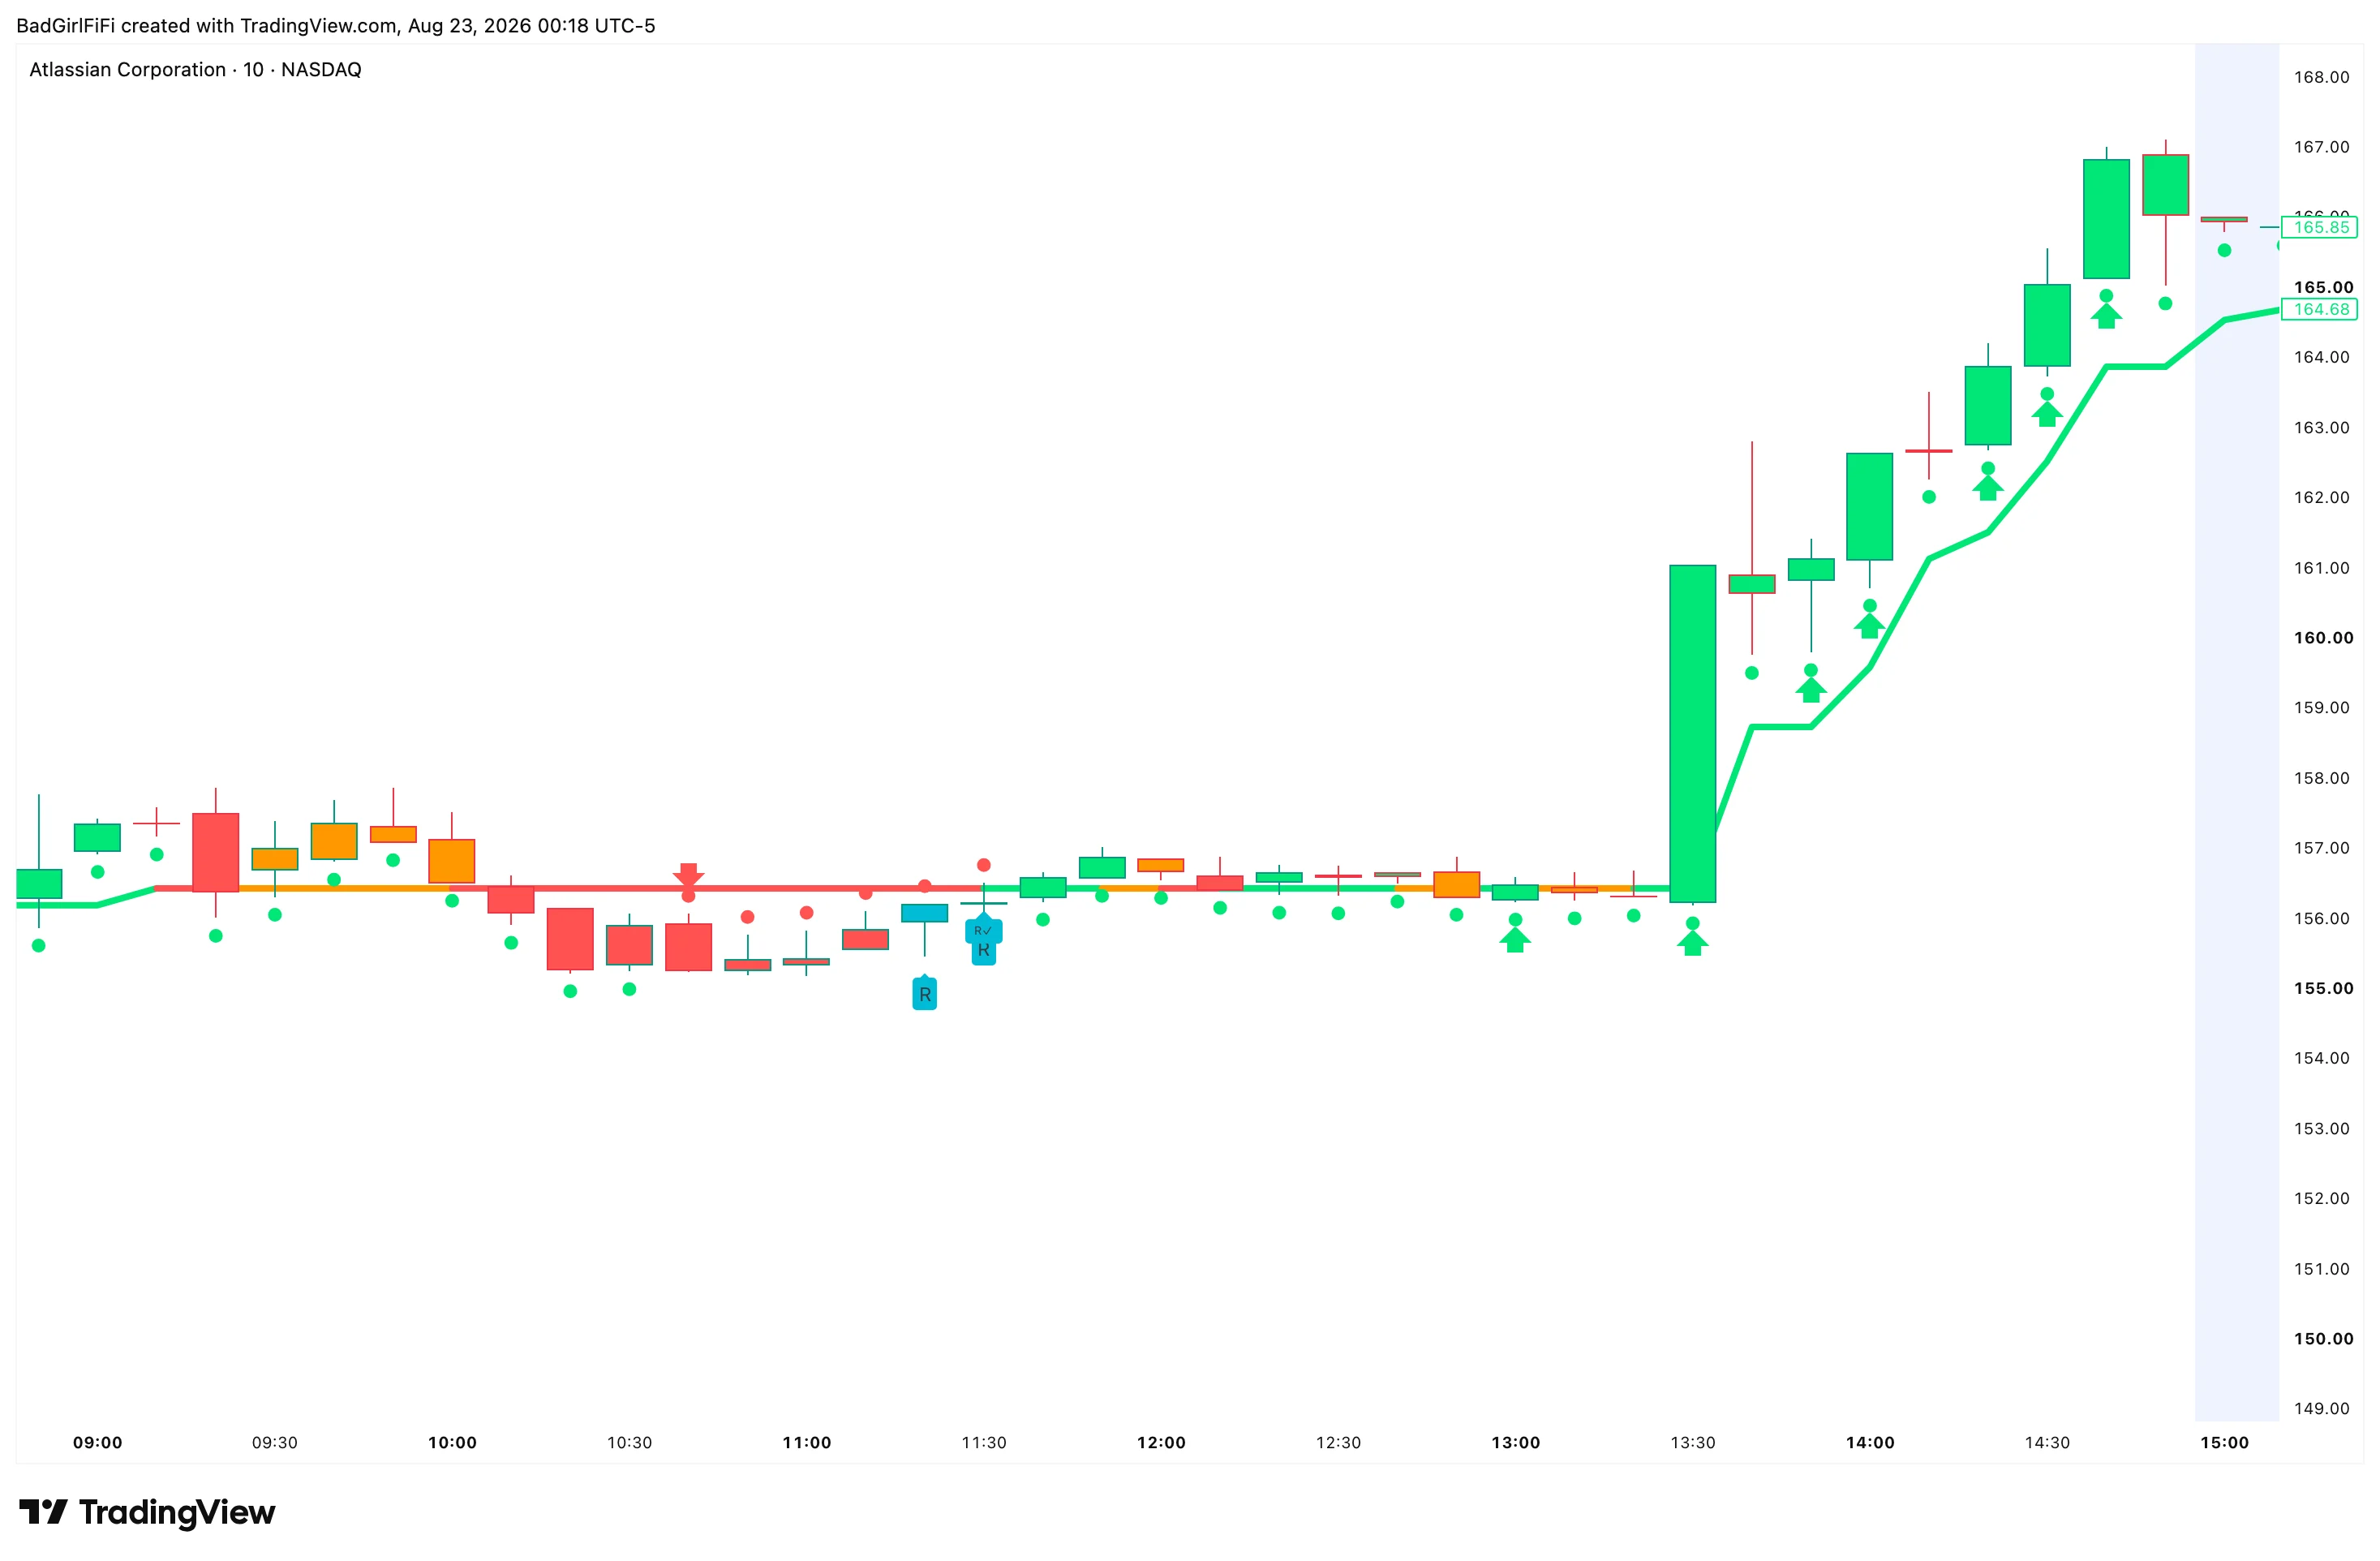 A flat spine through the base, then a clean flip and a run where price never closes back through it.
What it’s for, and what it isn’t
Best for: trend filtering · regime awareness · trade management · staying aligned with momentum.
Not: a signal generator · a standalone system · a reason to skip a stop.
Set your stop when you enter, every time. These are probability tools, and probability is sometimes wrong. A confirmed reversal that fails is exactly the situation a stop exists for.
With the rest of the engine
| Tool | Its job |
|---|---|
| Trend Spine | Market state and structure |
| TQE Swing / Intraday | Trade quality |
The best trades occur when all four line up: state reads Trend, spine direction agrees, dots confirm, and the TQE score is elevated.
Alerts
Two independent systems.
State change alerts fire when the market state flips — Trend to Transition, Transition to Chop. Leave “Alert only on CONFIRMED bar close” enabled; a state that flickers intrabar isn’t a state change.
An optional Early Warning: Approaching Flip fires before the state turns, when momentum is near the midpoint and price is near the spine. Off by default because it trades certainty for notice — turn it on only if you’d rather be early and occasionally wrong.
Multi-timeframe spine alerts monitor up to three higher timeframes — 1 hour, 4 hour and daily by default — and fire when the spine changes colour on any of them. This is the one to run. A daily spine flipping green while you’re working a 5-minute chart is information you’d otherwise only get by going to look.
Settings
Every layer switches off independently — spine, dots, tags, arrows, bar colouring, state label. If the chart feels busy, turn off layers rather than reaching for thresholds.
| Group | What it controls |
|---|---|
| Layer visibility | Spine, dots, tags, confirmed labels, strength and weakness arrows, trend bars |
| Top sensitivity | Regular or High — High marks tops earlier and more often |
| Trend Spine Intensity | Low, Medium, High — how responsive the spine is |
| Marker Render Mode | Shapes, or Labels as a fallback if markers don’t render on your setup |
| Core calculation | The lengths and sensitivity behind the spine and the tags — tuned as a set |
| Confirmations | The confirmation window per tag type, and bar-close-only confirmation |
| Colours | Bull, bear, transition, each reversal type, top and bottom |
| State label | Visibility, offset, size, background transparency |
| Alerts | State change, early warning, and the three monitored timeframes |
Three settings worth knowing about:
High sensitivity tops mark tension earlier and more often. More warning, more false alarms — it’s a genuine trade-off, not a better setting.
Marker Render Mode exists because shape markers don’t render on every configuration. If your tags have vanished, switch to Labels before assuming something is broken.
“Require Touch to Spine for Arrows” is off by default, and its own tooltip says why — with it on, arrows become rare.
FAQ
Which timeframe?
Any. The structure logic is timeframe-agnostic — run it where you trade, and use the multi-timeframe alerts to watch the higher ones.
What's the difference between a tag and a tag with a ✓?
The ✓ means the following bar closed beyond the tag bar’s wick in the tag’s direction. Without it, the tag was a candidate that didn’t follow through.
A tag failed. Is it useless?
No — often the opposite. A tag that fails to confirm frequently resolves the other way, which is a tradeable read in itself.
The bars stayed green while price dropped.
By design. The regime layer is built to hold through counter-moves so it doesn’t chop you out of trends. Judge it zoomed out.
A T tag appeared. Should I exit?
It marks a potential local top, not an exit order. Manage risk and stop pressing; wait for the next bar to tell you whether it confirmed.
My tags stopped appearing.
Check Marker Render Mode first — switch to Labels. Tags are also rare by design.
Should I trade off the spine alone?
No. It tells you what environment you’re in. Your setup and the qualifier tell you whether there’s a trade in it — and your stop goes in either way.
Walkthrough
Where this fits
Every indicator in the engine is documented to the same standard.