
Overview
The opening range — the high and low of the first minutes of the session — drawn as a box, with the levels the move measures to already plotted.
The opening range matters because it’s where the day’s first real fight happens. Overnight positioning meets the open, and the range that fight settles into becomes the reference the rest of the session trades against.
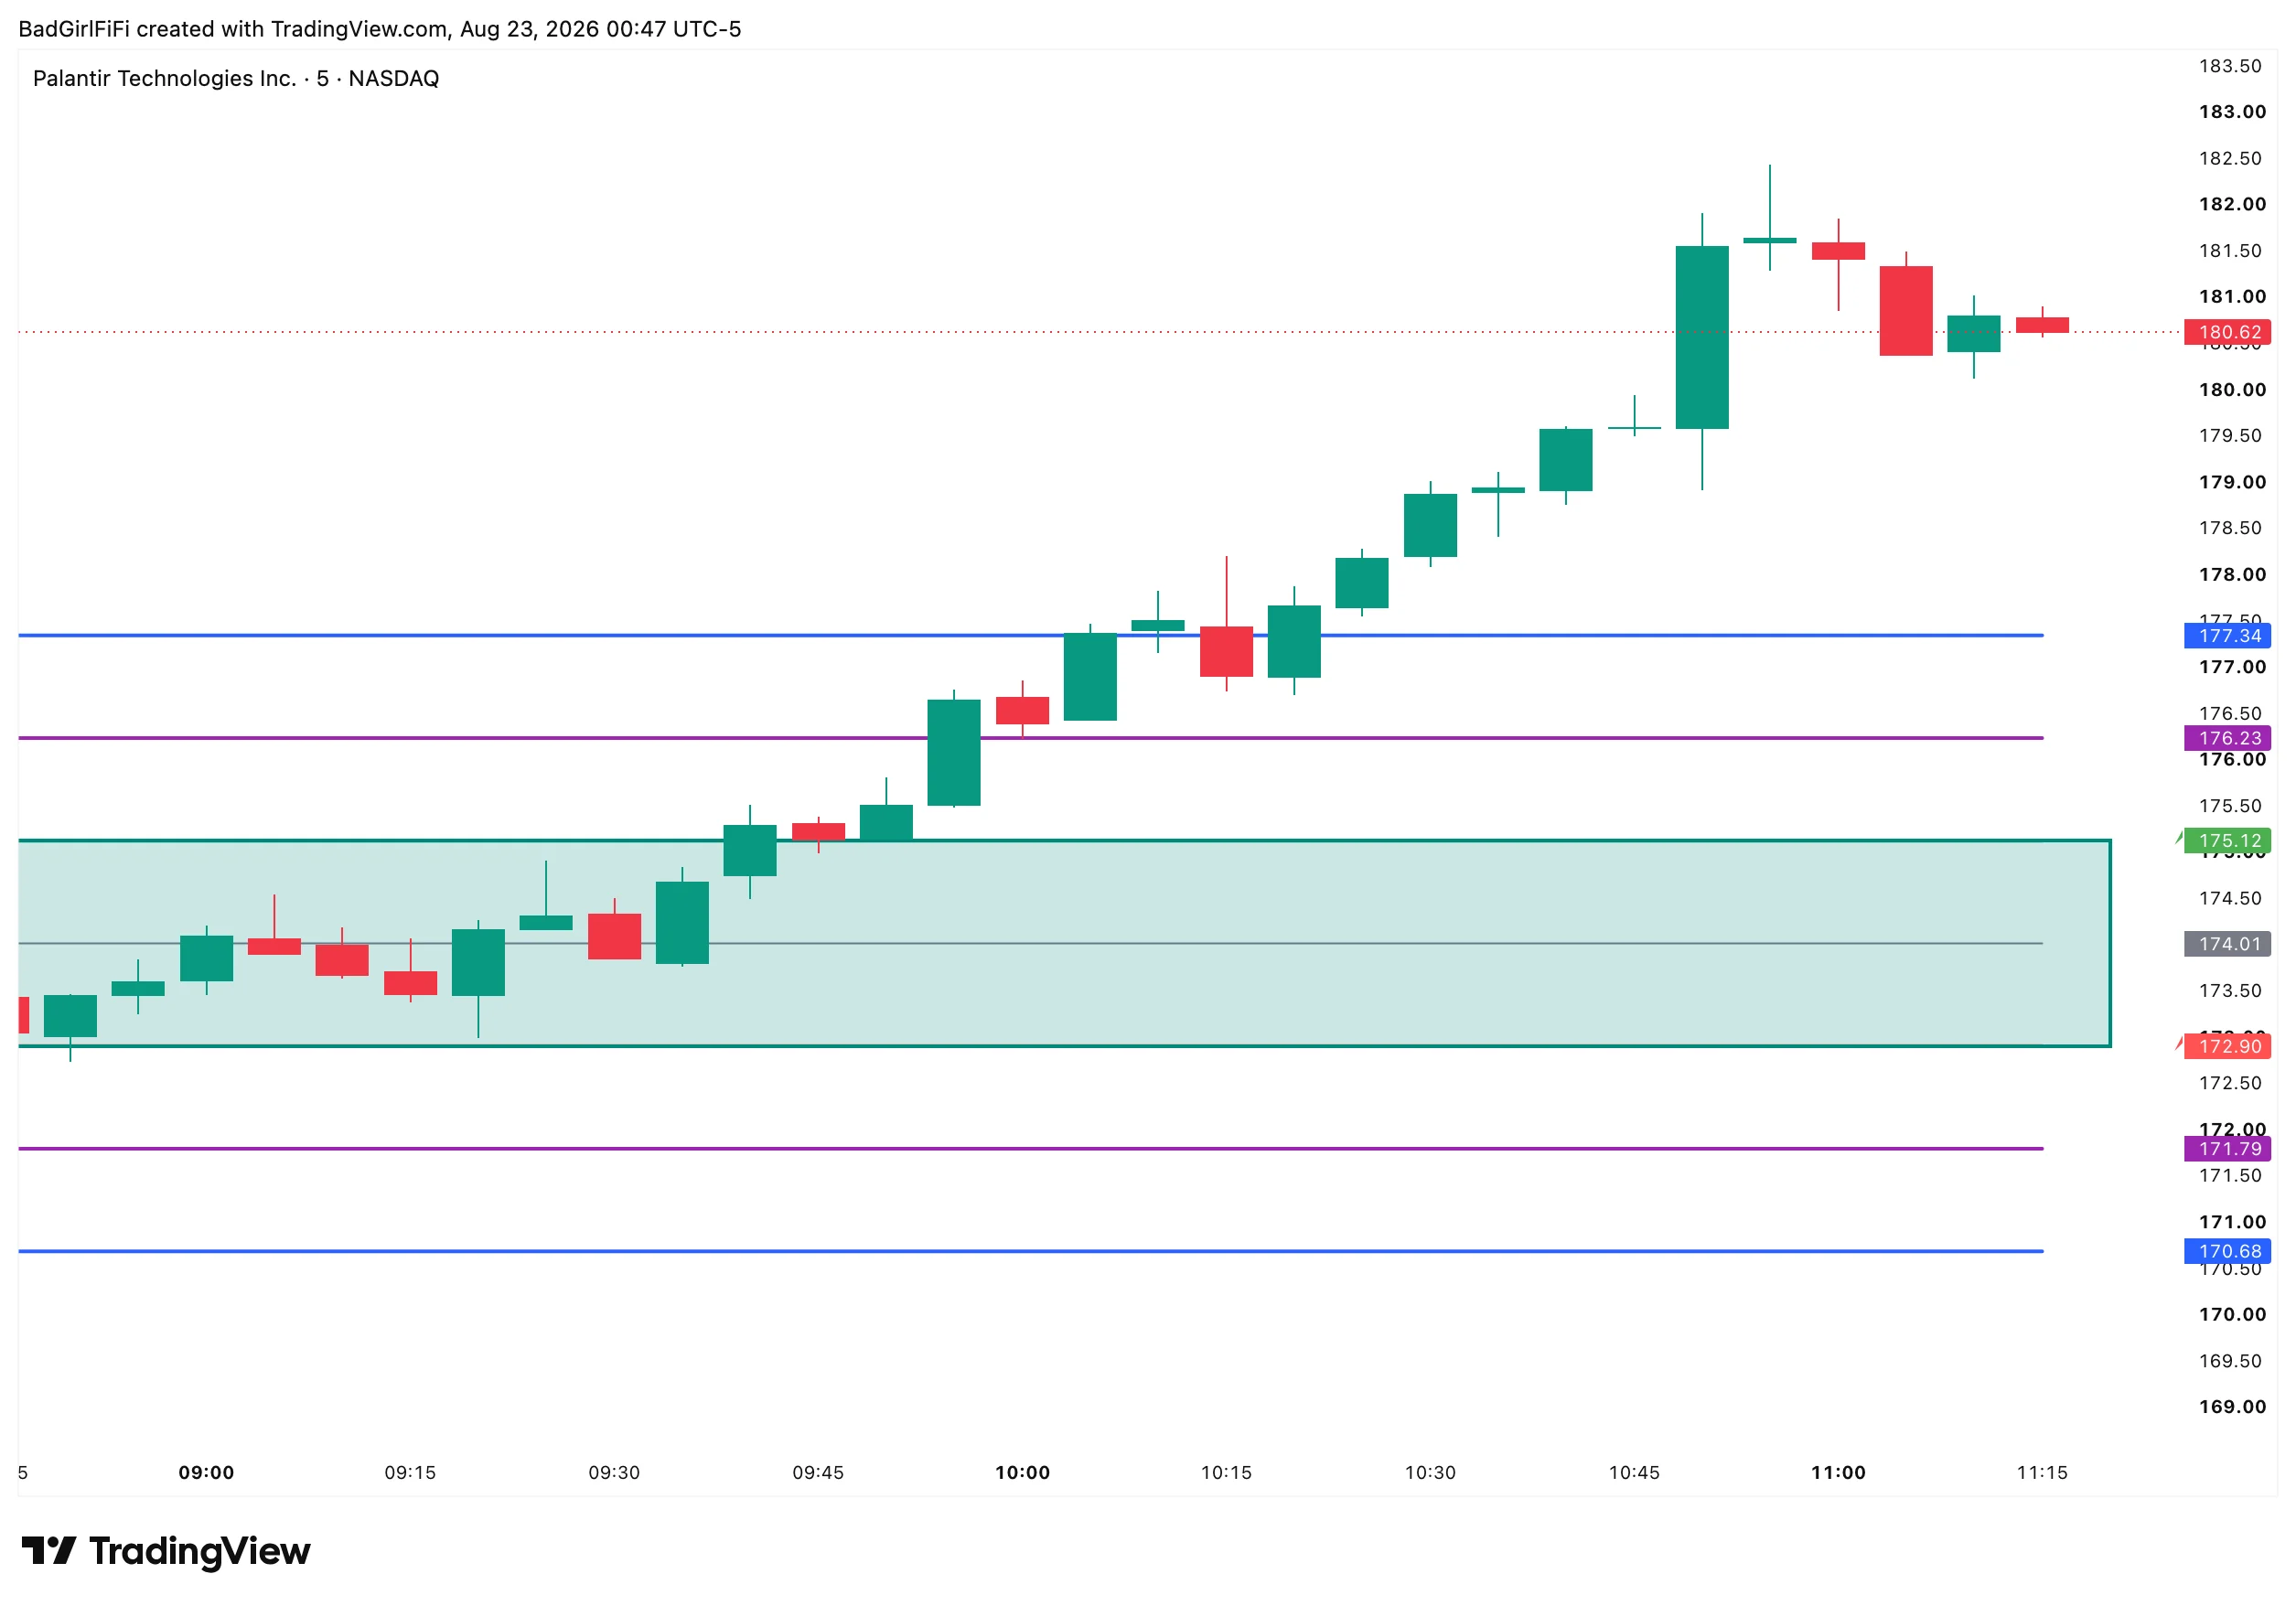 PLTR. The box is the 15-minute opening range, 172.90 to 175.12. Everything above and below it is projected from that range.
The range
Choose 5, 15 or 30 minutes from the open. The box draws once that window closes and then stays put for the rest of the session.
| Period | Window |
|---|---|
| 5 minutes | 09:30 – 09:35 |
| 15 minutes | 09:30 – 09:45 |
| 30 minutes | 09:30 – 10:00 |
15 is the default and the sensible starting point. Five minutes is fast but noisy — one aggressive order can set a range that means nothing. Thirty is reliable but by the time it completes, a lot of the day’s first move has already happened.
The midpoint can be shown as well. In a range-bound morning price tends to oscillate around it; once a breakout is underway, it becomes the level a failed move has to reclaim.
Targets are measured moves
This is the part that makes the indicator worth having on the chart rather than drawing two lines yourself.
Every target is the range height projected from the breakout edge. Take the chart above:
| Price | How it’s derived | |
|---|---|---|
| ORB high | 175.12 | The range top |
| ORB low | 172.90 | The range bottom |
| Range | 2.22 | 175.12 − 172.90 |
| 50% target | 176.23 | 175.12 + 1.11 |
| 100% target | 177.34 | 175.12 + 2.22 |
| 50% target (down) | 171.79 | 172.90 − 1.11 |
| 100% target (down) | 170.68 | 172.90 − 2.22 |
Extended targets at 150% and 200% are available and off by default — worth switching on for names that trend hard, unnecessary on most.
Purple is the 50% target, blue is 100%. Distinct colours because they’re different decisions: the 50% level is where a scalp comes off, the 100% is where the measured move completes.
A wide opening range means distant targets. The projection scales with the range, so a volatile open produces targets that need a real move to reach. That’s information before you take the trade — if the 100% target is four percent away, you’re not scalping it.
Breakouts and retests
With BRB enabled the indicator marks potential breakouts and the retests that follow them.
The retest is usually the better entry. A clean break out of the range that comes back to the edge and holds gives you a defined risk level — the range edge itself — instead of chasing the initial thrust with a stop somewhere arbitrary.
Previous days’ ranges
By default previous sessions keep their ORB boxes.
That’s more useful than it sounds. Yesterday’s opening range is a level today, and prior ORB highs and lows are places price frequently reacts. It also teaches you how a particular symbol behaves — whether it respects its opening range or ignores it entirely.
Switch it off if you want a clean chart for the current session only.
Where it draws
Intraday charts below 4 hours only. The indicator hides itself on the 4-hour and above, because an opening range plotted on a chart whose bars are longer than the range is meaningless.
Practically: 1, 5, 15, 30 minute and 1 hour charts. If the box has disappeared, check your timeframe first.
Trading outside the US session
The default is New York, 09:30. For other markets, set Period to 0 to unlock the override, then enter your own session in HHMM-HHMM form and pick your timezone — Amsterdam, Berlin, Kolkata, Shanghai, Tokyo and UTC are all available.
That’s how you get a 15-minute opening range on the Tokyo or London open rather than the New York one.
Alerts
“Alert only on ORB breakouts (not price ticks)” is the setting that matters, and it’s off by default.
Leave it off and alerts respond to price activity generally. Turn it on and you’re alerted only when price actually breaks the opening range — which is almost certainly what you want, since the breakout is the event and everything before it is just the range forming.
Settings
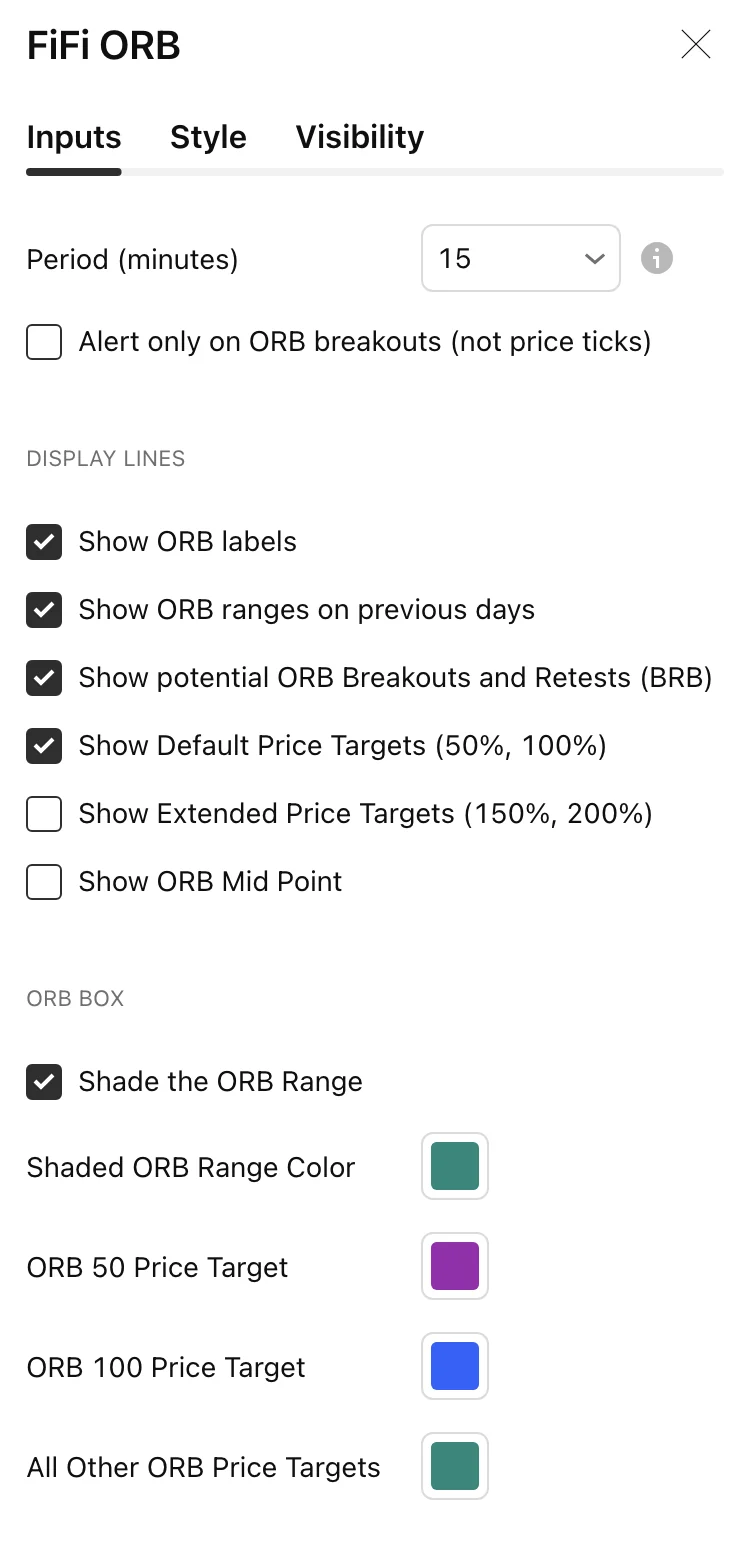
| Setting | Default | What it does |
|---|---|---|
| Period (minutes) | 15 | 5, 15, 30 — or 0 to use the international override |
| Alert only on ORB breakouts | Off | Restrict alerts to genuine breakouts |
| Show ORB labels | On | Price labels on each level |
| Show ORB ranges on previous days | On | Keep prior sessions’ boxes |
| Show potential Breakouts and Retests | On | The BRB markers |
| Show Default Price Targets (50%, 100%) | On | The two main projections |
| Show Extended Price Targets (150%, 200%) | Off | Further projections for trending names |
| Show ORB Mid Point | Off | The middle of the range |
| Shade the ORB Range | On | The filled box |
| Colours | Teal / purple / blue | Box, 50% target, 100% target, all others |
| Time Override + Timezone | 0930-0945, New York | Active when Period is set to 0 |
Related
ORB Adjustable + Sizing is the fuller version — same opening range concept with position sizing and tiering built in. This one is the clean, minimal take: the range, the targets, nothing else.
FAQ
Nothing is drawing.
Check your timeframe. The indicator hides itself on 4-hour charts and above.
Which period should I use?
15 minutes unless you have a reason. Five is noisy, thirty is late.
How are the targets calculated?
The range height, projected from the breakout edge. A 2.22 range gives a 100% target 2.22 above the high and 2.22 below the low.
Can I use it on a non-US market?
Yes — set Period to 0, then enter your session and timezone in the override group.
Why keep previous days' ranges?
Prior opening ranges act as levels. It also shows you whether a symbol respects its opening range at all, which is worth knowing before you trade its open.
Does it repaint?
The range is fixed once the opening window closes and doesn’t move afterwards.
Ready for the full engine?
This one is free. The Trade Qualification Engine is the paid suite it was built alongside.