
Overview
This one answers four questions instantly, every trading day:
- Where is the opening range?
- Has price broken it — long or short?
- How many shares can I trade, based on my account size?
- What’s my max risk, real-time P&L, and position tier?
Everything updates live and resets automatically each morning.
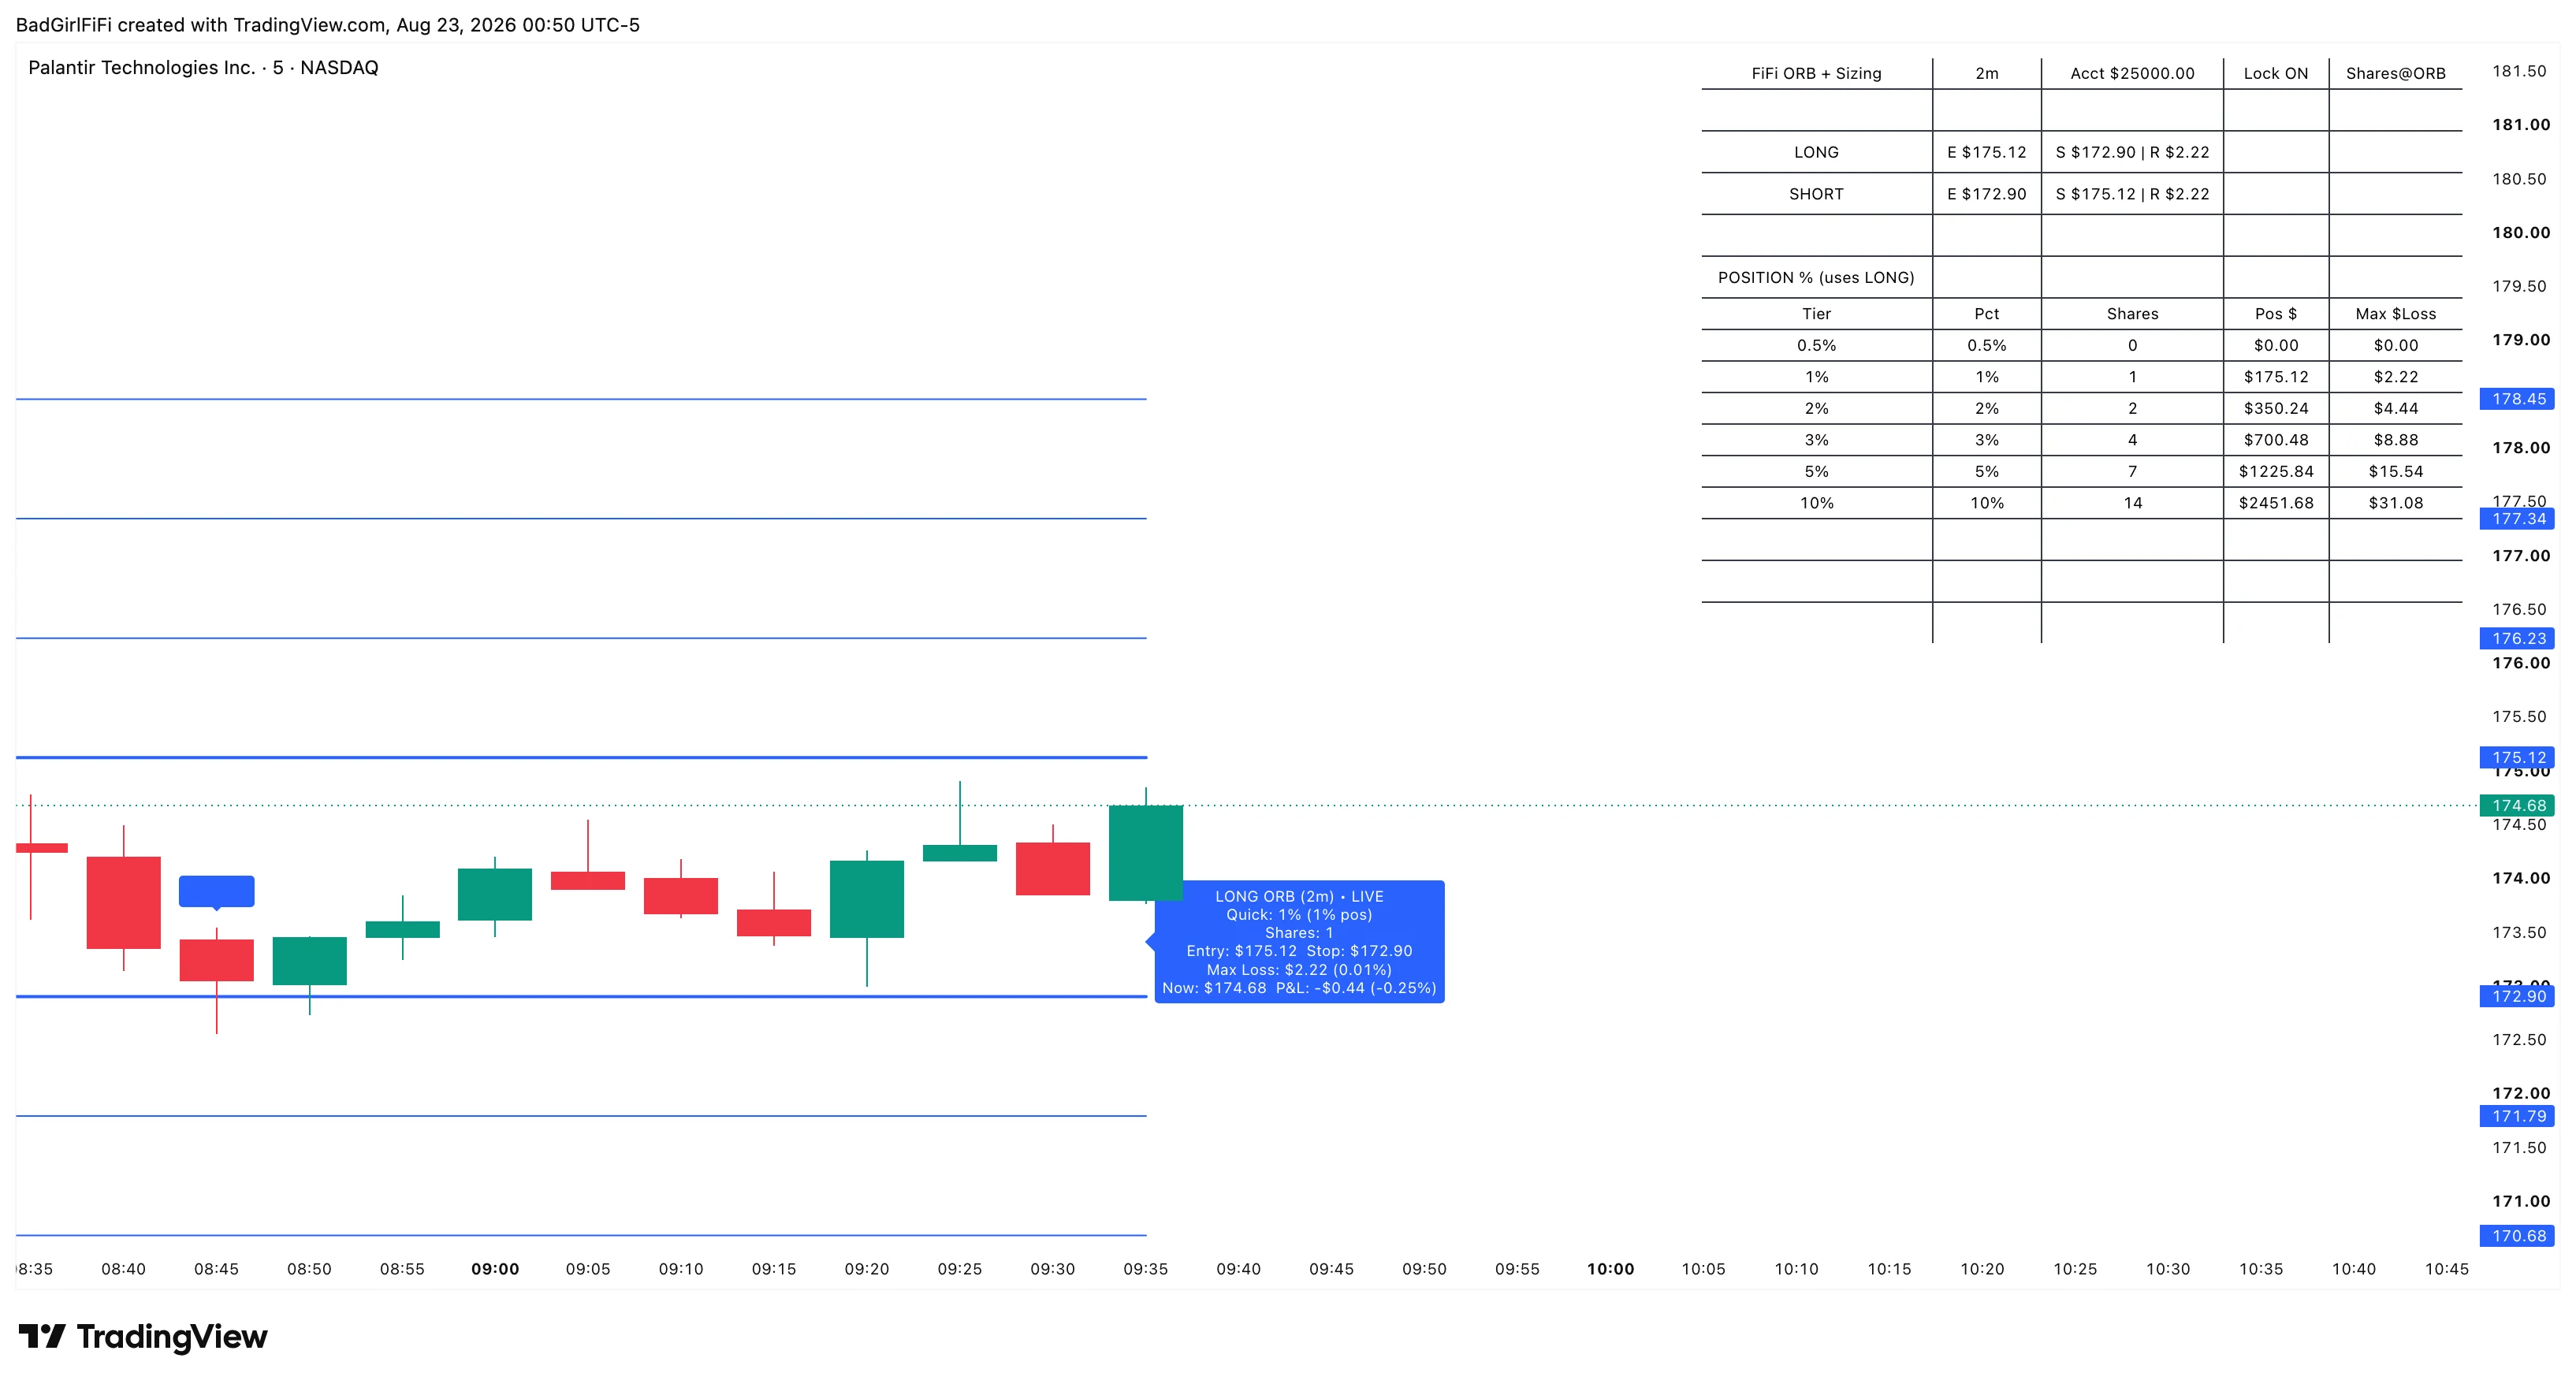 The range, the projected targets, the sizing table, and a live position label — all from one indicator.
If the ORB breaks, you already know: how many shares, how much risk, and what I lose if I’m wrong. That’s professional trading behaviour.
The range and the break
The opening range is the high and low of the first X minutes of the session — anywhere from 1 to 60, your choice. The default session is 09:30–16:00 exchange time.
Once the window closes, ORB High is resistance and ORB Low is support.
| Direction | Trigger | Entry | Stop |
|---|---|---|---|
| Long | Price breaks above ORB High | ORB High | ORB Low |
| Short | Price breaks below ORB Low | ORB Low | ORB High |
Stops are fixed at the opposite side of the range. That’s what makes the whole risk model work — the stop isn’t a judgement call, it’s a level the market defined for you in the first few minutes of the day.
Shorter ranges mean tighter stops and higher share counts. Longer ranges mean wider stops and fewer shares. A 2-minute range and a 30-minute range on the same stock produce completely different position sizes for the same dollar exposure. Choose the range you actually intend to trade, not the one that flatters the numbers.
Leave “LOCK Entry + Stop at Trigger” on. It freezes both levels the moment the break happens, which prevents the entry and stop drifting as the range recalculates. Without it, the numbers you sized on stop being the numbers you’re trading.
Position sizing — tiers are position size, not risk size
This is the distinction that matters most, and it’s the one people get wrong.
Each tier is a percentage of your account allocated to the position — not a percentage risked. Six tiers, adjustable, defaulting to 0.5%, 1%, 2%, 3%, 5% and 10%.
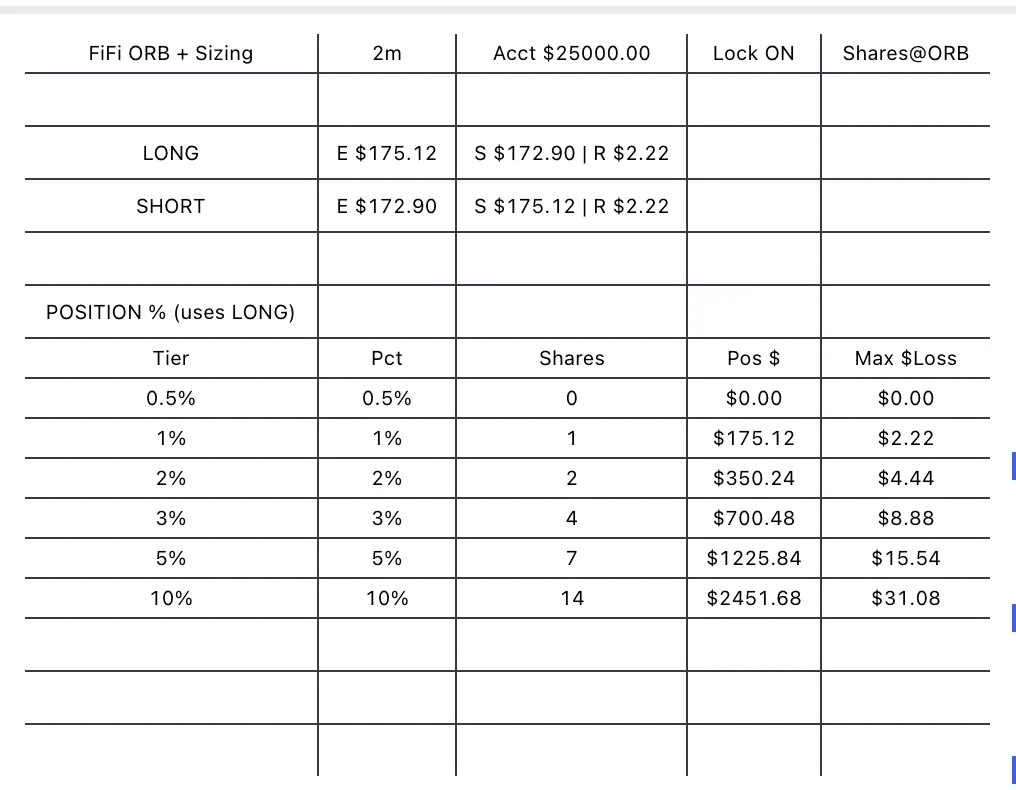
Worked example
From the chart above — a $25,000 account, a 2-minute range of 172.90 to 175.12, so entry 175.12 and risk $2.22 per share:
| Tier | Allocation | Shares | Position $ | Max loss |
|---|---|---|---|---|
| 0.5% | $125 | 0 | $0.00 | $0.00 |
| 1% | $250 | 1 | $175.12 | $2.22 |
| 2% | $500 | 2 | $350.24 | $4.44 |
| 3% | $750 | 4 | $700.48 | $8.88 |
| 5% | $1,250 | 7 | $1,225.84 | $15.54 |
| 10% | $2,500 | 14 | $2,451.68 | $31.08 |
Shares are the allocation divided by entry price, rounded down. Max loss is shares × the range height.
Look at the 10% row. A tenth of the account committed, and the maximum loss is $31.08 — about 0.12% of the account. That’s what a tight opening range does: it lets you take a meaningful position for trivial risk.
And that’s exactly the trap. A tight stop makes big size look free. It isn’t — a wider-than-expected gap through your stop, a halt, a fast tape, and that 10% position behaves like a 10% position. Don’t oversize just because the stop is tight.
Start at Tier 1 or 2 until your consistency justifies more. The tiers exist so that scaling up is a deliberate decision rather than a feeling.
The Quick Tier label
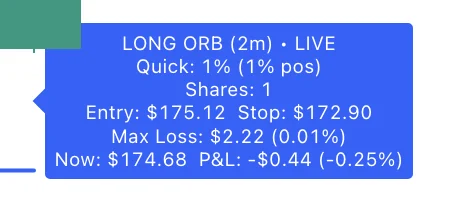
Pick a tier from the dropdown and the label previews that exact position without touching the table:
- Side — LONG or SHORT
- The ORB timeframe in use
- LOCKED or LIVE status
- Selected tier and share count
- Entry and stop
- Max loss in dollars and percent
- Live P&L, if enabled
It updates on the last bar only, so it stays clean and readable rather than trailing history across the chart.
Real-time P&L compares current price against entry, tick by tick, in both dollars and percent. It’s there for the decisions you make mid-trade — partial exits, trailing stops, whether the thing is working.
Targets
TP marks project the range height beyond the break: 50%, 100% and 150% of the ORB size. Same measured-move logic as the range itself, so a wide range produces distant targets and a tight one produces reachable ones.
Daily reset
At the start of each session everything clears itself: the range recalculates, locked entries and stops reset, P&L resets, the tables refresh. Nothing to clear manually.
Alerts
Alerts fire on long and short ORB breaks. Pair them with:
- TQE confirmations
- Trend Spine direction
- The ORB take-profit levels for management
Best practice
Do:
- Use it with trend context — Trend Spine or a higher-timeframe bias
- Trade with the session, not through chop
- Start at Tier 1–2 until consistency improves
- Lock entries once triggered
Don’t:
- Treat ORB as a standalone system
- Oversize just because the stop is tight
This tool isn’t about prediction. It’s about structure, risk control, consistency and execution clarity.
Settings
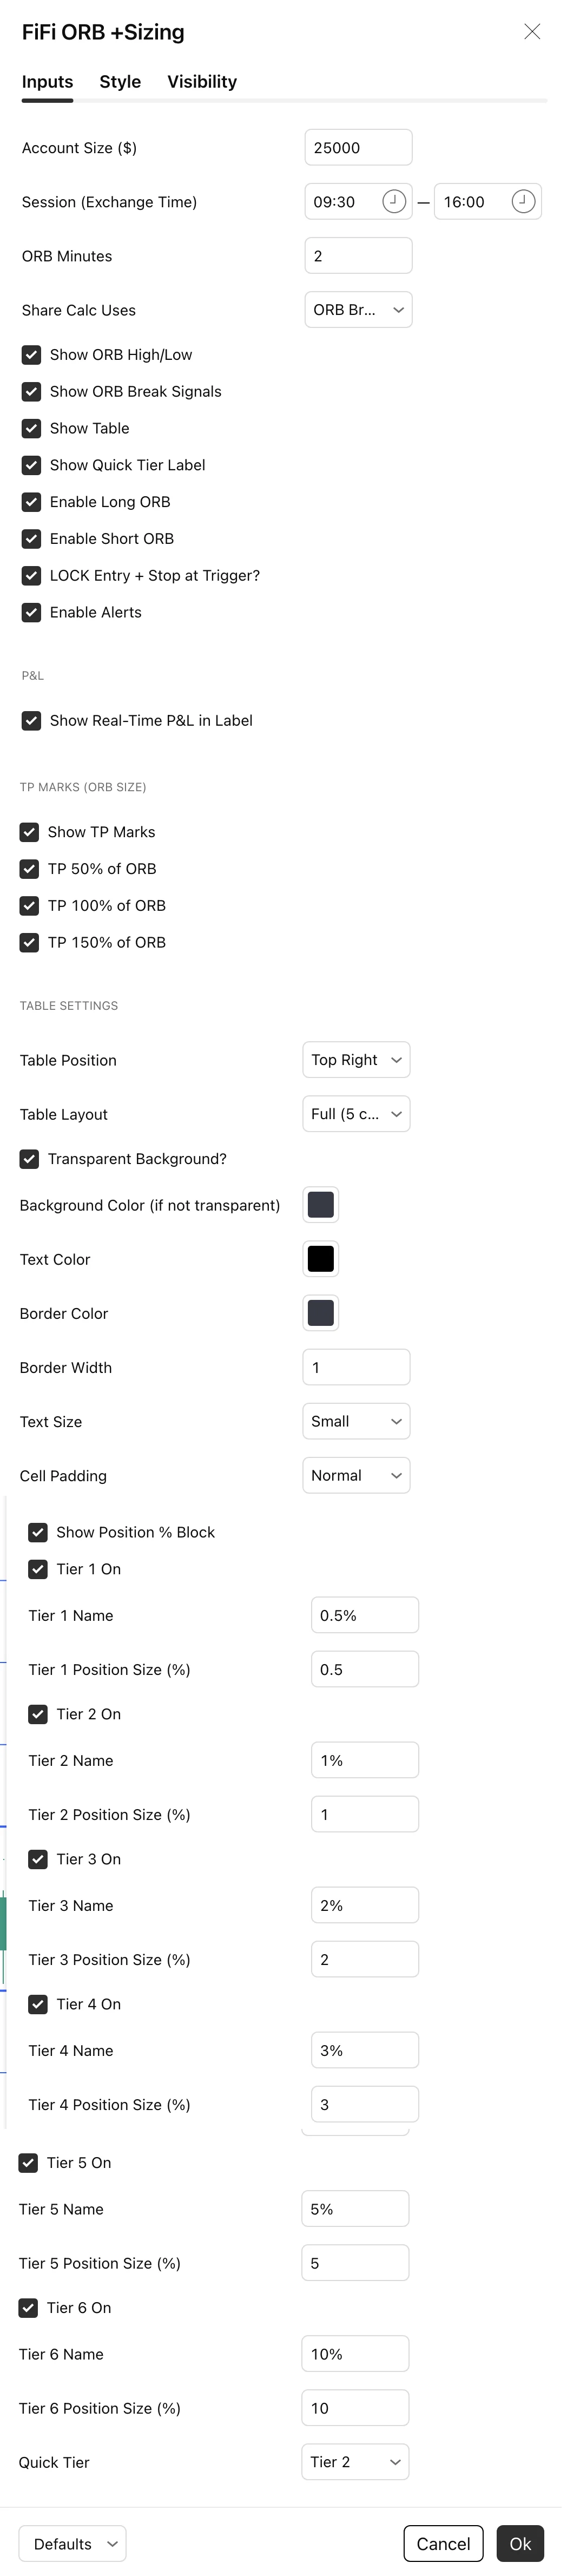
| Setting | Default | What it does |
|---|---|---|
| Account Size ($) | 25,000 | Drives every sizing and risk calculation |
| Session (Exchange Time) | 09:30–16:00 | When the range is built |
| ORB Minutes | 2 | Length of the opening range, 1 to 60 |
| Share Calc Uses | ORB Break Price | Or current price |
| Show ORB High/Low, Break Signals, Table, Quick Tier Label | On | Layer visibility |
| Enable Long / Short ORB | On | Which sides are tracked |
| LOCK Entry + Stop at Trigger | On | Freezes levels at the break — leave on |
| Enable Alerts | On | Break alerts |
| Show Real-Time P&L in Label | On | Live P&L in the label |
| TP Marks — 50 / 100 / 150% | On | Measured-move targets |
| Tiers 1–6 | 0.5 / 1 / 2 / 3 / 5 / 10% | Name and percentage per tier |
| Quick Tier | Tier 2 | Which tier the label previews |
| Table Position / Layout | Top Right / Full | Full (5 cols), Compact (4), Ultra-Compact (3) |
| Table styling | — | Transparent or solid, colours, border, text size, padding |
Table Layout is worth adjusting. Full gives you everything; Ultra-Compact keeps the footprint minimal when you’re running several indicators. The table rebuilds automatically when you change it.
Related
ORB is the minimal version — the range and its targets, no sizing. Use that one if you size positions elsewhere; use this one if you want the share count worked out before the break.
FAQ
Are the tiers risk percentages?
No — position percentages. Tier 2 puts 1% of your account into the trade; what you risk is the share count times the range height, which is usually far smaller.
Why does the 0.5% tier show zero shares?
The allocation was smaller than one share at that price. On a $25,000 account, 0.5% is $125 — less than one share of a $175 stock.
What ORB length should I use?
Whatever you actually trade. Shorter ranges give tighter stops and bigger share counts; longer ranges give wider stops and fewer shares. Both are valid; mixing them up isn’t.
Should I turn LOCK off?
No. It keeps the entry and stop you sized on from drifting after the break.
Does anything carry over between days?
No. Everything resets at the session open automatically.
Ready for the full engine?
This one is free. The Trade Qualification Engine is the paid suite it was built alongside.