
Overview
TQE Swing asks whether a name is worth your attention this week. Intraday asks whether it’s worth your attention right now.
It runs a fixed checklist of intraday conditions — where price sits against the levels that matter, whether trend and VWAP agree, and whether the move has already run too far to join. Every condition is scored for both long and short at the same time, and the header tells you the count.
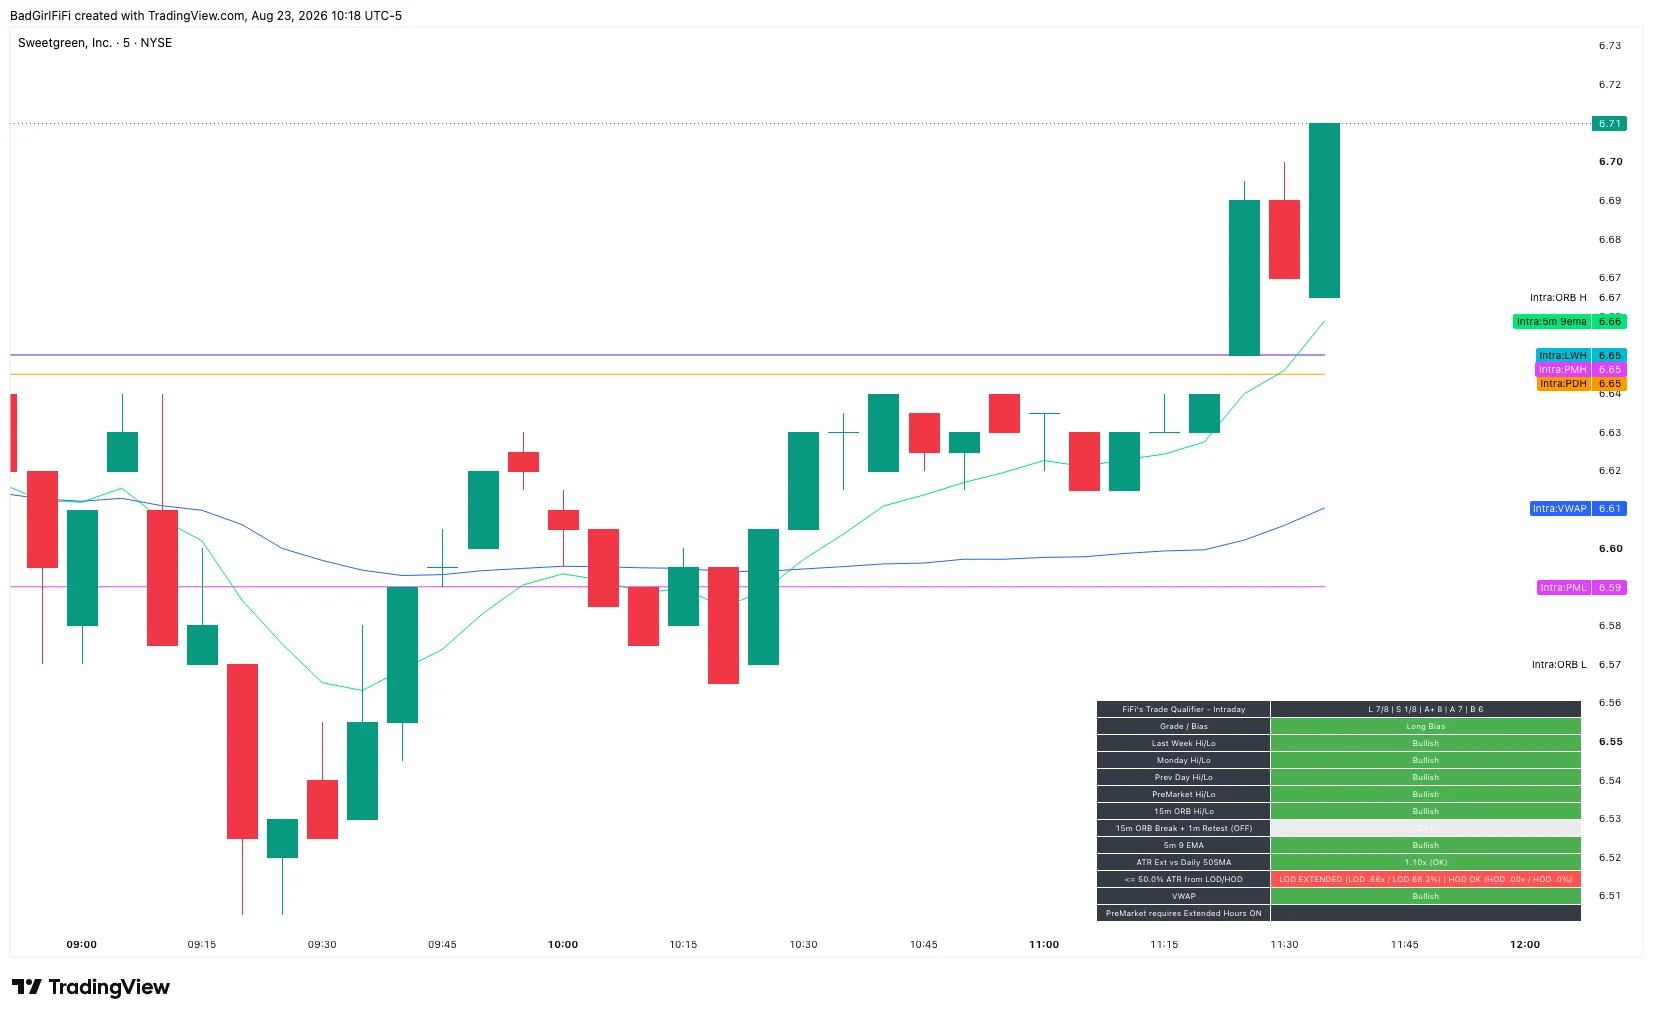 The checklist bottom right, the optional level plots on price. Seven of eight conditions long, one of eight short.
The table only draws on intraday charts. Switch to a daily and it disappears rather than showing you something meaningless. Leave the indicator loaded — it costs you nothing while it’s hidden.
This is one half of a pair. The intraday engine ships as two scripts because TradingView could not carry the dashboard and the alerting engine in a single indicator. This one is the dashboard — the checklist UI and the level plots. Its partner, TQE — Intra WL Alerts, is the alerting engine and puts tags on the chart. Install both; neither is the whole tool on its own.
Reading the header
Everything you need is in the top row.
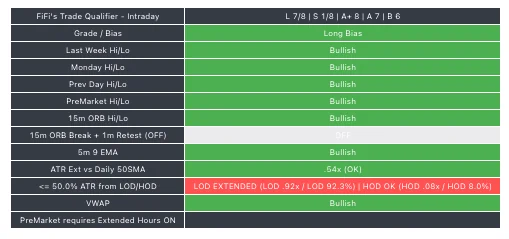
L 7/8 | S 1/8 | A+ 8 | A 7 | B 6| Part | Meaning |
|---|---|
| L 7/8 | Seven of the eight enabled conditions are bullish |
| S 1/8 | One is bearish |
| A+ 8 · A 7 · B 6 | How many it takes to reach each tier |
The denominator is the number of conditions you have enabled, not a fixed nine. Turn one off and the denominator drops. The tier thresholds clamp themselves so they can never ask for more conditions than exist — disabling three doesn’t leave A+ permanently unreachable.
The Grade / Bias row underneath translates the counts into the call: Long Bias, Short Bias, or neutral when neither side has separated.
Both sides are always scored. A board that reads 7/8 long and 1/8 short is a real alignment. One that reads 4/8 and 4/8 is a market with no opinion, and the honest response is to leave it alone rather than pick a side.
The conditions
Each row is one test, coloured green for bullish, red for bearish, neutral when price sits inside the level.
| Row | What it’s testing |
|---|---|
| Last Week Hi/Lo | Price above last week’s high, below its low, or inside the range |
| Monday Hi/Lo | Same logic against Monday’s range |
| Prev Day Hi/Lo | Against yesterday’s high and low |
| PreMarket Hi/Lo | Against the premarket range |
| 15m ORB Hi/Lo | Against the first fifteen minutes of the regular session |
| 15m ORB Break + 1m Retest | Optional. A 1-minute close outside the range followed by a wick back to it |
| 5m 9 EMA | Above or below the 5-minute 9 EMA, whatever timeframe you’re on |
| VWAP | Above or below session VWAP |
| LOD/HOD distance | Whether the move has already run too far from the extreme to join |
The first five are location — the same question asked at five different scales, from last week down to the opening fifteen minutes. When all five agree you’re not looking at a level, you’re looking at a name that has cleared every reference point traders are watching.
5m 9 EMA and VWAP are the trend pair. The 9 EMA is short-term momentum, VWAP is where the day’s volume actually traded. Both onside is a trend the session is participating in.
The ORB retest row is optional and ships off
It’s a structure confirmation rather than a direction call, and when it’s on it counts toward both sides. Most people leave it off — it tightens the board considerably and there’s no partial credit for a break that hasn’t retested yet. Turn it on when you specifically trade the retest.
The don’t-chase condition
This is the row that changes how the tool behaves, and it’s worth understanding properly.
It measures how far price has travelled from the low of day (for longs) or the high of day (for shorts), expressed as a multiple of ATR or a percentage of it. Past your threshold, the condition goes red.
LOD EXTENDED (LOD .66x / LOD 66.2%) | HOD OK (HOD .00x / HOD .0%)Read that as: price is 0.66 ATR above the day’s low — too far to be entering a long — while sitting right at the high, which is where a short would want to be.
The logic runs against your instincts on purpose. The strongest-looking chart on the screen, the one at highs and pulling away, is exactly the one that fails this test. That’s the point. It costs you the tail of moves you’d have caught, and saves you the entries where all the room was already gone.
It will cost you trades that work. In the chart above the board sat at 7/8 all session, held back by this one row, and price ran another 5% from there. The gate is a deliberate trade of upside for a better average entry — not a prediction that the move is over.
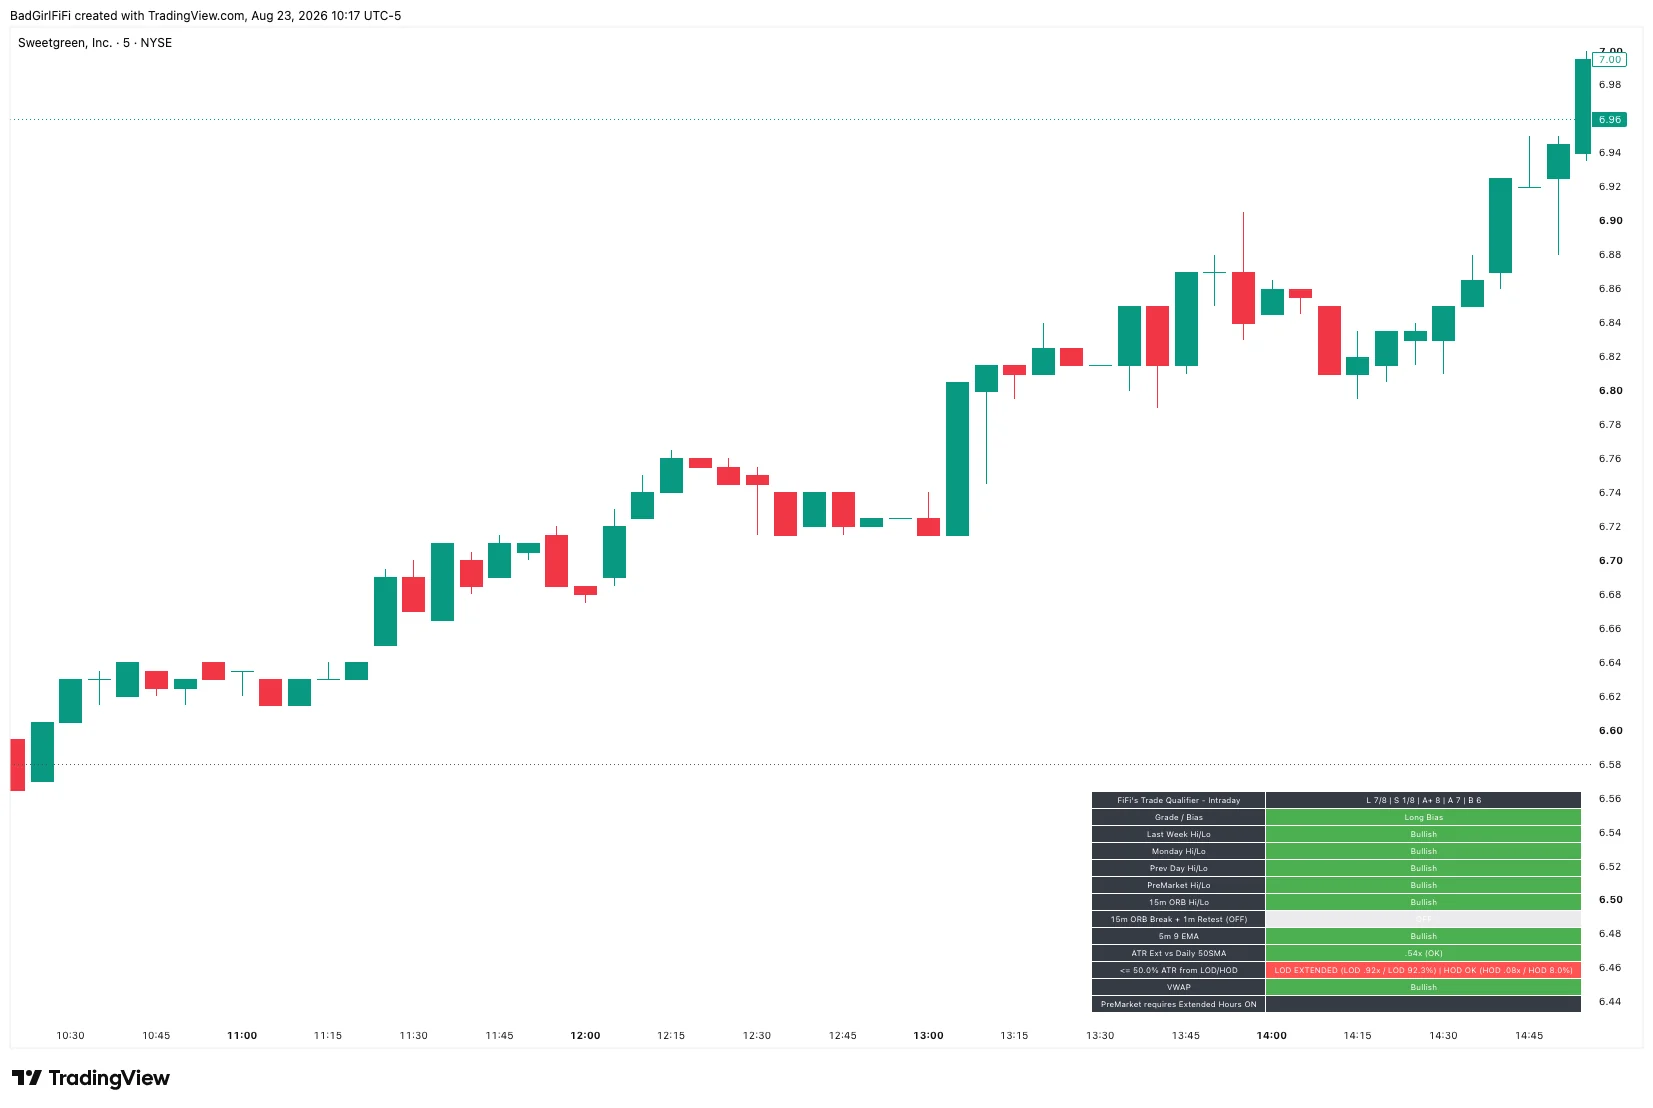 Two hours later. Still seven of eight, still held at A by the distance rule, still going.
You control the threshold and whether it reads in ATR multiples or percent. Wider tolerance means more signals and worse fills.
The extension filter
Separate from the checklist, and it doesn’t score — it blocks.
The filter compares price against the daily 50 SMA and expresses the gap in daily ATRs. Past your ceiling, long alerts stop firing regardless of how good the board looks.
1.10x (OK)          →  longs allowed
6.08x (TOO EXTENDED) →  longs blocked
If longs go quiet and shorts don’t, check this row first. That’s the answer nearly every time. It’s a long-only gate; short alerts are unaffected.
Alerts
The alert engine is built for one thing: firing when it should and staying silent otherwise.
| Behaviour | Effect |
|---|---|
| Bar close only | Nothing fires mid-bar and then un-fires |
| Threshold cross | Alerts on entering a tier, not every bar you remain in it |
| 15-minute cooldown | After a long fires, longs stay quiet for fifteen minutes. Shorts the same, separately |
| Named conditions | Standard TradingView alert conditions, not alert() calls |
Because these are named conditions, you pick them from the Condition dropdown when you create the alert — you do not need “Any alert() function call”. The available conditions are the six direction-and-grade combinations (A+/A/B, long and short) plus the combined ones most people actually use: A+ or A LONG and A+ or A SHORT.
For a watchlist, set the alerts on Intra WL Alerts instead — that’s the half built to run across many symbols at once, and its page has the step-by-step.
The watchlist setup
This is how the tool is meant to be used, and how FiFi runs it:
- 15-minute interval, trigger Once Only
- Alerts on A+ or A LONG and A+ or A SHORT
- Conditions on, apart from anything you don’t trade
- Plots off
Set it across a watchlist and you get a handful of clean pings a day rather than a stream. If you want fewer still, alert on A+ only.
The execution setup
On the chart you’re actually trading from — 1m or 5m — keep the table on and turn on the plots for ORB, VWAP and the 5m 9 EMA so you can see the levels the board is scoring against.
Plots
All eight level plots plus the daily 50 SMA ship off, so the indicator adds nothing to your chart until you ask it to. Turn on the ones you want:
Last Week Hi/Lo · Monday Hi/Lo · Prev Day Hi/Lo · PreMarket Hi/Lo · 15m ORB Hi/Lo · 5m 9 EMA · VWAP · Daily 50 SMA
There’s a smoothing option for the lines. Set the smoothing length to 1 if you want levels that sit exactly where they are — smoothing makes them easier on the eye and slightly wrong.
Setup notes
Turn on Extended Hours. The premarket row and the premarket plots need it. Without it the row reads wrong or blank, and there’s a permanent reminder at the bottom of the table for exactly this reason. Some tickers have no premarket data at all, which is a data problem rather than an indicator one.
The ORB row is empty for the first fifteen minutes. It can’t be anything else — the range isn’t built yet. It locks in once the window closes.
Leave PDH/PDL on Prior Day RTH. The alternative uses the prior daily bar’s high and low, which on an extended-hours chart includes overnight moves nobody was watching. Regular-hours levels are the ones other traders have on their charts.
Mobile Mode shrinks the table for phone screens. On a desktop layout leave it off.
Settings worth knowing
| Setting | Default | Why you’d change it |
|---|---|---|
| Table Position / Text Size / Padding / Row Height | Bottom Right · Tiny · Normal · Compact | Fitting it around your other indicators |
| Show Disabled Conditions | On | Off hides rows you’ve switched off, for a shorter table |
| Flash Header on Alert Signal | On, 600ms | The header flashes green on a long, red on a short |
| Pre-Market session | 04:00–09:30 | Only if you want a different premarket window |
| RTH session | 09:30–16:00 | Drives both the ORB and prior-day levels |
| PDH/PDL = Prior Day RTH | On | Leave it |
| Long ATR Extension Filter | On | Your tolerance for chasing extended longs |
| LOD/HOD threshold | Set in ATR or percent | The don’t-chase gate — the single most consequential number here |
| Daily Source | Regular | Which daily series feeds the ATR and 50 SMA |
The defaults are the intended configuration. The alert behaviours — bar close, threshold cross, cooldown — are deliberately not adjustable, because every “why didn’t my alert fire?” problem traces back to one of those three being loosened.
FAQ
The table disappeared.
You’re on a daily or higher chart. It’s intraday-only by design and comes back when you drop back down.
Why is my count out of 8 and not 9?
One condition is switched off — almost always the ORB retest, which ships off. The denominator is however many you’ve enabled.
Shorts are firing and longs aren't.
Check the ATR extension row. If it says TOO EXTENDED, long alerts are being blocked on purpose.
The board reads 7/8 but nothing fired.
Alerts fire on crossing into a tier, at bar close, and not within fifteen minutes of the last one on that side. Sitting at 7/8 for an hour produces one alert, not twelve.
The premarket row looks wrong.
Turn on Extended Hours. If it’s still blank, that ticker doesn’t have premarket data.
Which alert should I use for a watchlist?
A+ or A LONG and A+ or A SHORT, on the 15-minute, set to Once Only.
Do I need the Intra WL Alerts script too?
Yes, if you want alerts across a watchlist and the chart tags. This one is the dashboard.
Does it work on futures or crypto?
It’s built around a regular-hours equity session — premarket, RTH open, opening range. On instruments without those boundaries, most of the board stops meaning anything.
Walkthrough
Where this fits
Every indicator in the engine is documented to the same standard.