
Built by Braamskis, included with TQE membership.
Overview
Every option someone buys has a dealer on the other side, and that dealer doesn’t want directional risk. To stay neutral they hedge — and because an option’s delta changes as price moves, they have to keep re-hedging all day long.
That forced hedging is real, mechanical buying and selling. It happens at predictable prices. This indicator plots those prices.
It’s for the indices — QQQ, SPY, SPX, NQ. That’s where the options open interest is concentrated enough for the effect to dominate.
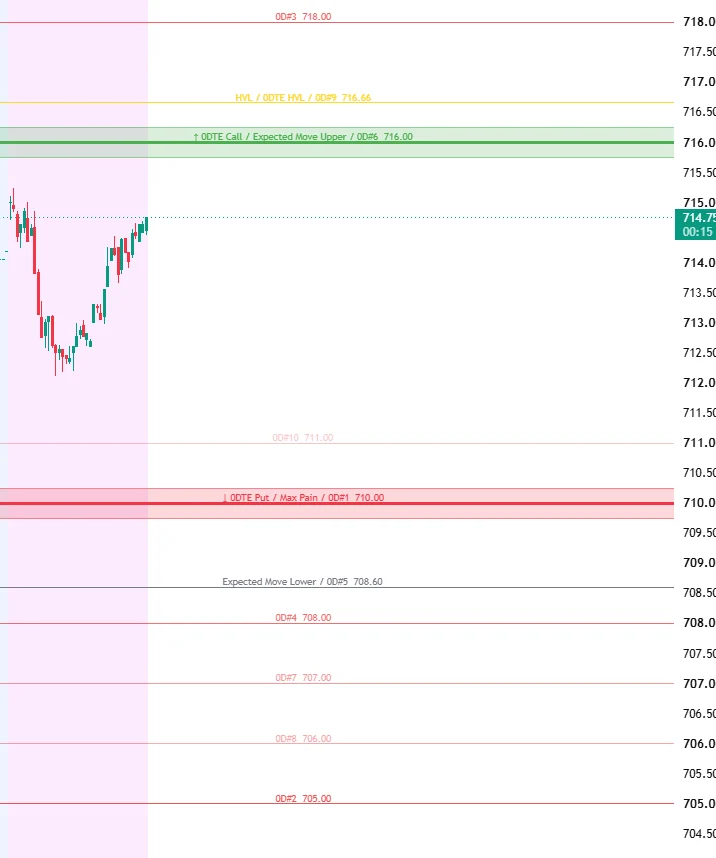 Every level labelled with what it is and where it sits. The shaded bands are the call and put walls.
Long gamma or short gamma changes everything
Before any individual level matters, check which regime you’re in. It inverts the entire playbook.
| Regime | What dealers are doing | What price does |
|---|---|---|
| Long gamma | Hedging against the move — selling into strength, buying weakness | Moves get dampened. Price chops and reverts. |
| Short gamma | Hedging with the move — buying strength, selling weakness | Moves get amplified. Price trends and accelerates. |
Same level, opposite meaning. A call wall in long gamma is a ceiling you fade. The same call wall in short gamma is a magnet price gets pulled through.
Read the regime first, every time. Trading a long-gamma playbook in a short-gamma tape is the single most expensive mistake this tool can help you avoid — and the easiest one to make, because the levels look identical on the chart either way.
The levels
HVL — High Volatility Level
The strike nearest spot where gamma flips sign. Above it price tends to behave as though in positive gamma; below it, negative.
This is your local regime pivot and the most actionable intraday level on the chart. Watch it as the trigger line — price crossing HVL is the market changing character, not just changing price.
Call Wall / Call Resistance
The strike carrying the largest positive gamma — the biggest concentration of call-side dealer exposure.
- Long gamma: a ceiling. Dealers sell into approaches, price stalls. A level to fade.
- Short gamma: a target. Dealers buy into approaches, price gets pulled toward it and often through.
Put Wall / Put Support
The strike carrying the largest negative gamma — the put-side mirror.
- Long gamma: a floor. Dips get bought.
- Short gamma: a trigger. Breaking it starts a cascade rather than finding support.
Zero Gamma / Gamma Flip
Where cumulative dealer gamma nets to zero across the whole chain — the aggregate regime boundary, as opposed to HVL’s local one. Above it dealers stabilise; below it they amplify.
When Zero Gamma sits far from spot while HVL sits close, the structure is lopsided — and fragile. The two boundaries disagreeing means the aggregate picture and the near-the-money picture are telling different stories. Trust HVL for intraday in that situation.
Expected Move
The market’s own estimate of travel by expiration, derived from the at-the-money straddle price. It plots as an upper and lower bound — roughly one standard deviation, so price stays inside it about 68% of the time by the close.
Useful as a reality check on targets. A move that requires price to finish well outside the expected move is a move the options market is pricing as unlikely.
Max Pain
The strike where the greatest dollar value of options expires worthless — the price that minimises total payout across all outstanding contracts. Where option buyers lose most and sellers profit most.
Two datasets, two speeds
Every core level comes in both flavours, separately toggled:
| What it is | Use it for | |
|---|---|---|
| All-Expiry | The full chain across every expiration | Structure. Slower-moving, bigger picture. |
| 0DTE | Same day only | The intraday game. Faster, sharper, more relevant to today. |
0DTE HVL is the level most people watch. Same-day gamma is where the hedging pressure is most concentrated and most immediate.
The dashboard
A corner table that puts the whole picture in one place: the current gamma regime, where the call and put walls sit, where HVL and Zero Gamma are and which one is currently valid, plus a short trade plan for the regime you’re in.
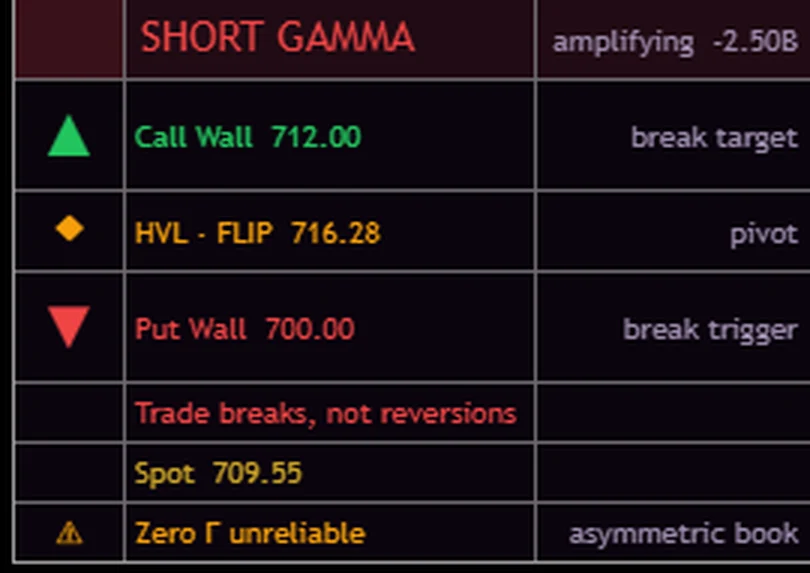 Short gamma, so the walls read as break targets and triggers rather than places to fade — and the playbook line says so outright. The warning row flags that Zero Gamma is unreliable here because the book is lopsided.
It’s laid out spatially — call wall on top, HVL in the middle as the mean, put wall on the bottom — so it reads like the chart rather than like a table.
You can put it in any corner, and choose whether it displays 0DTE or All-Expiry walls.
The arrows
The arrows on the dashboard and on the wall labels exist for one reason: to stop you reading a level the wrong way round.
| Regime | Arrows | Meaning |
|---|---|---|
| Long gamma | Point inward — Call ↓, Put ↑ | Fade toward the mean |
| Short gamma | Point outward — Call ↑, Put ↓ | Trade the breaks |
They’re a visual reminder of the inversion. In short gamma the walls are accelerants and price rips through them; in long gamma they’re reversal zones where you watch for the bounce.
Regime source
| Setting | Behaviour |
|---|---|
| Auto (default) | Reads the Regime: line from your pasted data, falling back to the sign of Net GEX |
| Force Long / Force Short | Override, for testing how a playbook looks in the other regime |
| Off | No regime logic |
Force is a study tool, not a trading setting. Leave it on Auto when you’re live.
GEX Top 10
The ten highest-gamma strikes, plotted as ranked lines.
Pick a dataset from the dropdown — None, 0DTE, All Expiries, or the top-5-only version of either — then use the individual toggles to hide any of the ten you don’t want.
Colour carries the sign: green for positive (call-dominated) strikes, red for negative (put-dominated), with a neutral fallback if a strike’s sign can’t be read from the data.
Turn on “Scale Opacity by Strength.” With it on, the lines fade by rank — the strongest strike renders solid and the weakest nearly disappears. Without it, ten equally bright lines tell you where the strikes are but not which ones matter, which is most of the value.
Reading the walls
The wall levels get highlighted boxes rather than plain lines, so they stand out from everything else.
Box Height is the one setting you must tune per ticker. It’s specified in price units, not percent, so a value that works on QQQ is invisible on NQ:
| Ticker | Suggested box height |
|---|---|
| QQQ | 0.3 – 0.5 |
| SPX | 1 – 2 |
| NQ | 10 – 20 |
Opacity defaults to a subtle fill with a more visible border. Wall lines are drawn thicker than regular levels by default — leave that alone, it’s what makes them readable at a glance.
You have to paste the data in
This is the most important operational fact about the indicator, so it gets its own section.
Nothing renders until you paste data. The levels come from a GEX text output posted in the members’ Discord under #gamma-data. You copy it, open the indicator settings, and paste it into the Paste GEX Levels Data box. The script parses every dollar value out of the text and plots it.
It does not auto-update. There is no live feed. The levels on your chart are frozen at whatever you last pasted.
How often to re-paste
Every 10 to 15 minutes, or every 0.2% move on the index — whichever comes first. Gamma positioning shifts as price moves and as the day’s options trade; levels that were accurate an hour ago may not be.
Stale data looks exactly like fresh data. The lines don’t fade, grey out, or warn you. A chart you loaded at the open and left alone will still be showing the open’s levels at 2pm, rendered with the same confidence as if you’d pasted them a minute ago. Build the re-paste into your routine — this is the failure mode that catches people.
The levels are prices, not symbol-aware. Paste QQQ data and switch your chart to SPY and the lines stay exactly where they were, now meaningless. Re-paste when you change instruments.
Using it
Regime first, level second. Every level’s meaning depends on the regime. Get that backwards and the tool works against you.
HVL is the intraday trigger. More than any other single line, watch price crossing it.
When HVL and Zero Gamma disagree, favour HVL and treat the structure as fragile.
Expected Move bounds your targets. If your thesis needs price outside them, the options market disagrees with you — that’s not a reason not to take the trade, but it is information about the odds.
Pair it with structure. Gamma levels tell you where forced hedging lives. They don’t tell you the trend. Trend Spine and TQE Key Levels fill that in.
Settings
| Group | Setting | What it does |
|---|---|---|
| Data Input | Paste GEX Levels Data | The text box. Nothing works without it. |
| All-Expiry | HVL / Call Resistance / Put Support | Colour and show-hide for each |
| 0DTE | 0DTE HVL / Call / Put | Same three, same-day only |
| Advanced | Zero Gamma, Max Pain, Expected Move, Flip Zones | Colour and show-hide for each |
| Wall Highlights | Show Highlight Box | Master toggle for the wall boxes |
| Wall Line Width | Thicker than regular lines so walls stand out | |
| Box Height (± from line) | Tune per ticker — see the table above | |
| Box Opacity / Border Opacity | Fill and border transparency | |
| Regime Arrows & Dashboard | Show Arrows on Wall Labels | Directional arrows on the wall labels |
| Show Regime Dashboard | The corner table | |
| Dashboard Position | Which corner | |
| Dashboard Walls | 0DTE or All-Expiry | |
| Regime Source | Auto, Force Long, Force Short, or Off | |
| GEX Top 10 | Show GEX Levels 1-10 | None, 0DTE, All Expiries, or top-5 versions |
| GEX #1 – #10 | Per-strike show-hide | |
| GEX Sign Colors | Positive / Negative / Neutral | Green, red, and the unparsed fallback |
| Scale Opacity by Strength | Rank-based fading — leave on | |
| Strongest / Weakest Transparency | The ends of that fade | |
| Style | Line Width, Line Style, Extend Lines | Solid/dashed/dotted; both/right/left/none |
| Labels | Label Size, Offset, Side | Text size, distance from the last bar, left or right |
FAQ
Does it update automatically?
No. You copy the data from #gamma-data in the Discord and paste it into the settings every time you want current levels.
How often should I re-paste?
Every 10–15 minutes, or after every 0.2% move on the index.
Nothing is showing on my chart.
You haven’t pasted data yet, or the paste didn’t take. Reopen the settings and check the text box.
Which ticker does it work on?
Indices and index futures — QQQ, SPY, SPX, NQ. It needs the concentrated options open interest that only the indices have.
What's the difference between HVL and Zero Gamma?
HVL is the local flip nearest spot; Zero Gamma is the aggregate flip across the whole chain. When they’re far apart, the structure is lopsided and HVL is the one to trust intraday.
Why do the walls behave differently on different days?
Because the regime changed. In long gamma walls are reversal zones; in short gamma they’re accelerants. Check the dashboard before reading any level.
What does the Expected Move actually tell me?
Roughly where price is expected to stay through expiration, about two-thirds of the time. It’s the options market’s own estimate, not a prediction.
Can I force a regime?
Yes, and it’s useful for learning what each playbook looks like. Set it back to Auto before you trade off it.
Where this fits
Every indicator in the engine is documented to the same standard.